Application Monitoring Console
Administrator/Ops user has the ability to query, visualize, alert on, and explore U-Analyze Conversations metrics through Grafana tool. This tool allows to turn your time-series database (TSDB) data into beautiful graphs and visualizations. It enables Administrator/Ops user to view graphical overview of readymade dashboards to have high level understanding of health and performance of system by collecting telemetric data for 3rd party services and product usage.
Now with Grafana dashboards, Administrator/Ops user can monitor the following metrics and derive insights from these metrics:
Services Metrics
The 3rd party services listed below are currently supported:
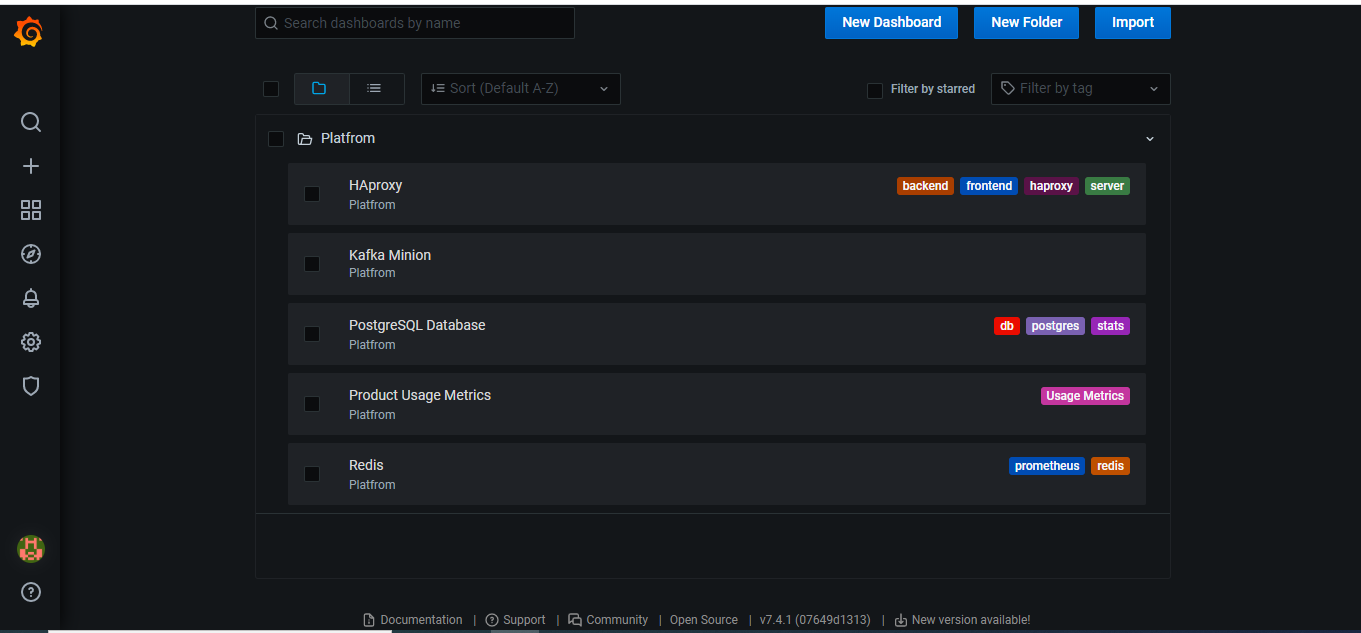 |