HA Proxy Monitoring
HAproxy exposes an endpoint for the metrics and it can be enabled during the installation. Following command with EXTRA_OBJS flag during installation enables metrics endpoint:
make TARGET=linux-glibc USE_PCRE=1 USE_OPENSSL=1 USE_ZLIB=1 USE_CRYPT_H=1 USE_LIBCRYPT=1 USE_SYSTEMD=1 EXTRA_OBJS="contrib/prometheus-exporter/service-prometheus.o"
Note
Check if the currently installed service is having the EXTRA_OBJS flag, if not continue with the following steps:
If HAProxy is already installed without EXTRA_OBJS flag, we need to uninstall the existing one and install again with EXTRA_OBJS flag. The steps are given below.
Note
Take the backup of the haproxy configuration files before performing the following steps, usually the location of the config file is /etc/haproxy/haproxy.cfg.
yum remove haproxy
LATEST_HAPROXY=$(wget -qO- http://www.haproxy.org/download/2.0/src/ | egrep -o "haproxy-2\.[0-9]+\.[0-9]+" | head -1)
wget http://www.haproxy.org/download/2.0/src/${LATEST_HAPROXY}.tar.gz
tar xzvf ${LATEST_HAPROXY}.tar.gz
yum install gcc-c++ openssl-devel pcre-static pcre-devel systemd-devel -y
cd /home/centos/${LATEST_HAPROXY}
make TARGET=linux-glibc USE_PCRE=1 USE_OPENSSL=1 USE_ZLIB=1 USE_CRYPT_H=1 USE_LIBCRYPT=1 USE_SYSTEMD=1 EXTRA_OBJS="contrib/prometheus-exporter/service-prometheus.o"
make install
Add the following to the haproxy configuration file ( /etc/haproxy/haproxy.cfg):
frontend stats
bind *:8404
option http-use-htx
http-request use-service prometheus-exporter if { path /metrics }
stats enable
stats uri /stats
stats refresh 10s
Now the metrics is available in 8404 port and can be verified by hitting the endpoint.
curl http://127.0.0.1:8404/metrics
Once we get the metrics, add /etc/prometheus/prometheus.yml in prometheus.yml and restart the prometheus docker container:
- job_name: 'haproxy'
metrics_path: '/metrics'
scrape_interval: 5s
static_configs:
- targets: ['172.31.36.120:8404']
Login to Grafana and import custom dashboard (HAProxy.json) for HAproxy.
Following metrics are visualized in Grafana Dashboards:
Server - Backend services and all the nodes where the services are running collectively called as server (ex : cms-nodes is a backend service node-cms-001, node-cms-002, node-cms-003 are instances of the service)
Connection - Frontend establishing a connection to Haproxy and Haproxy establishing a connection to backend ( not a full session )
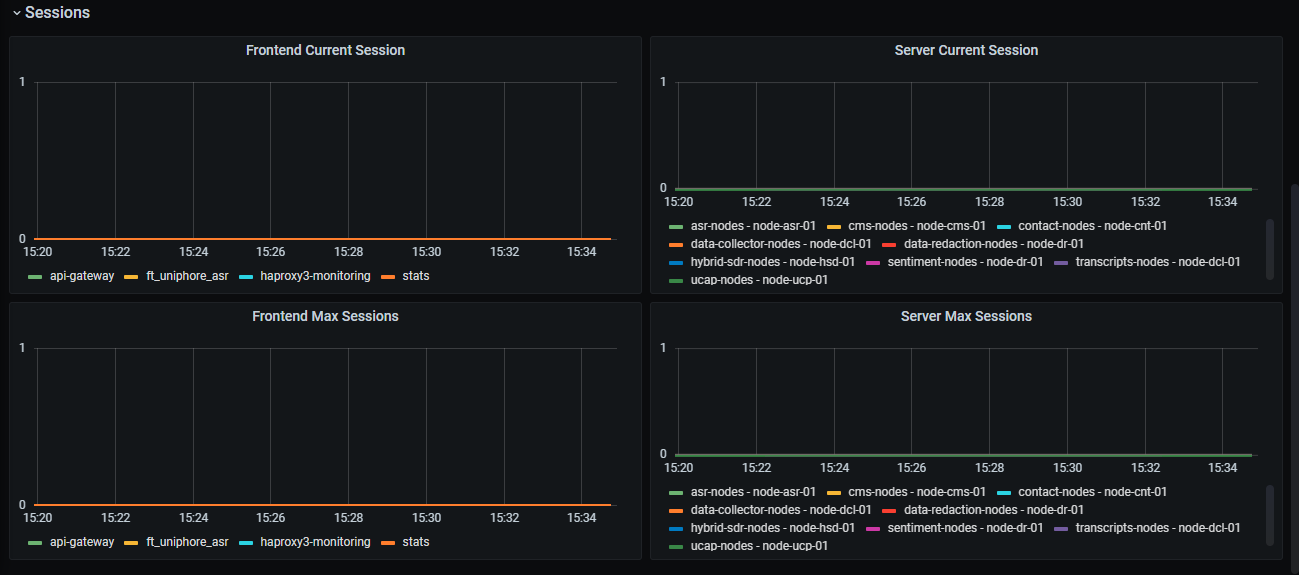
Session - Complete end-to-end connection is called a session (client to HAProxy and HAProxy to backend server)
Queue - The Queue section applies only to backends and shows how long clients are waiting for a server to become available
Note
Most of the metrics are in vector so the metrics show increase in the count relative to the time frame selected.
 |
Process Information
Version - Installed HAProxy version
Uptime - Relative time from when HAProxy is up(ex: 5 days ago)
Start time - HAProxy started date and time
Max memory bytes - Max memory bytes set for the HAProxy process
Used memory bytes - Number of memory bytes which is used
Allocated memory bytes - Number of memory bytes allocated.

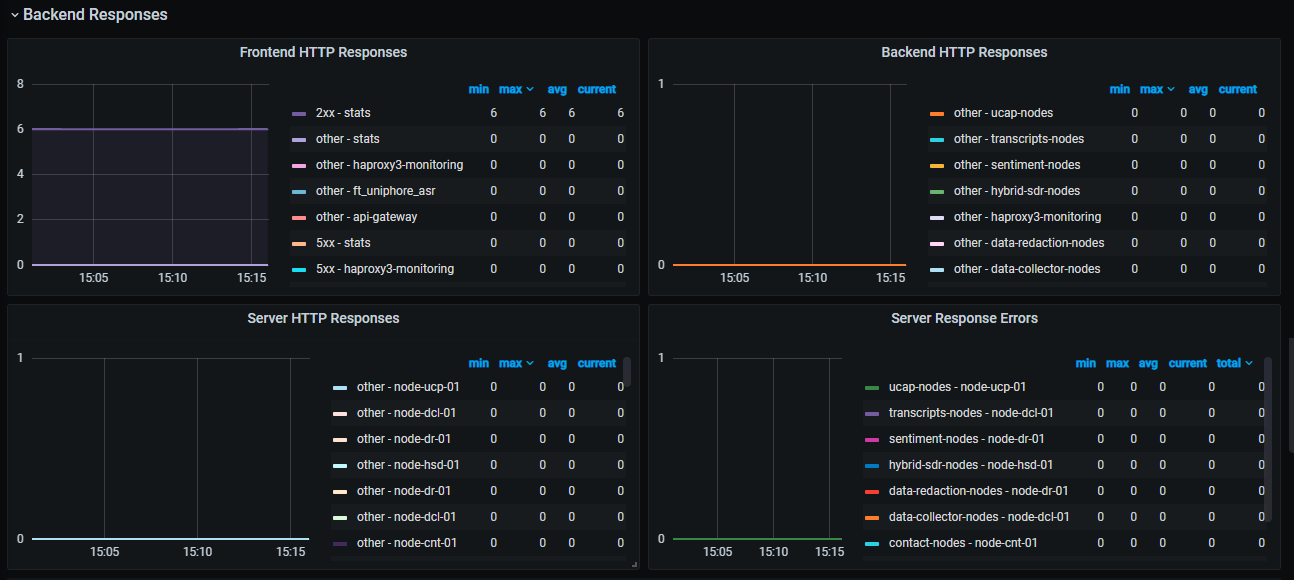
Backend Responses
Frontend HTTP responses - Increase in the count of frontend http response in the selected time frame
Backend HTTP responses - Increase in the count of backend http response in the selected time frame
Frontend Bytes In - Increase in the total number of bytes recieved
Server HTTP responses - Same as Backend HTTP response, visualized backend and node wise
Server Response Errors - Increase in the backend response errors, visualized backend and node wise.
Frontend Bytes Out - Increase in the total number of bytes sent
Server Bytes In - Increase in the total no of bytes recieved, visualized service and instance(node) wise
Server Bytes Out - ncrease in the total no of bytes sent, visualized service and instance(node) wise
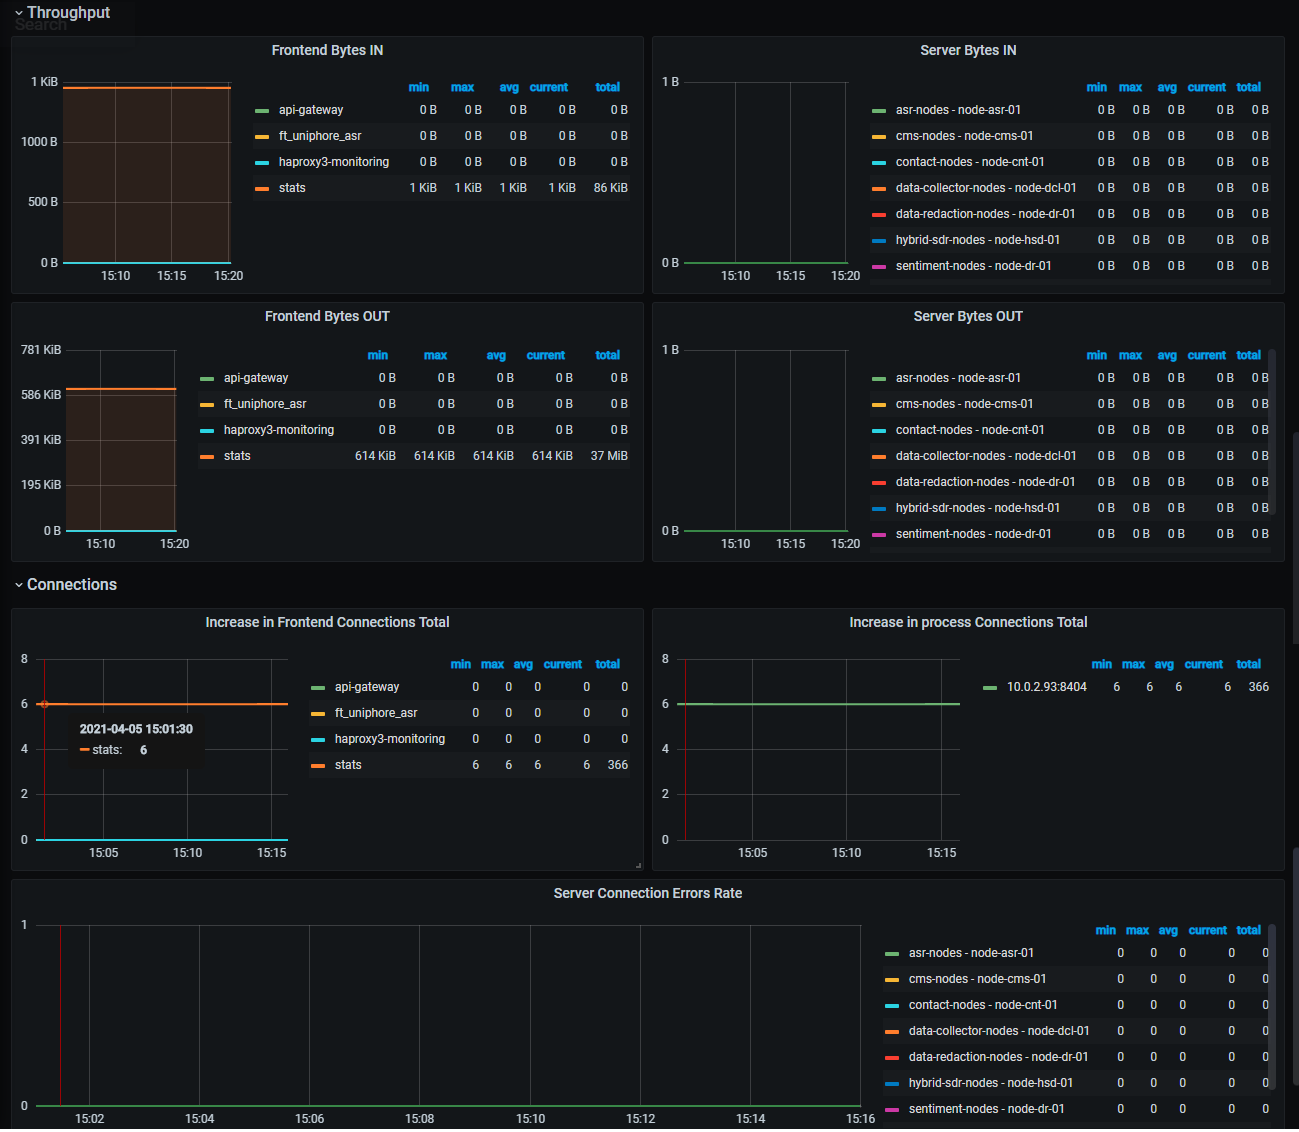
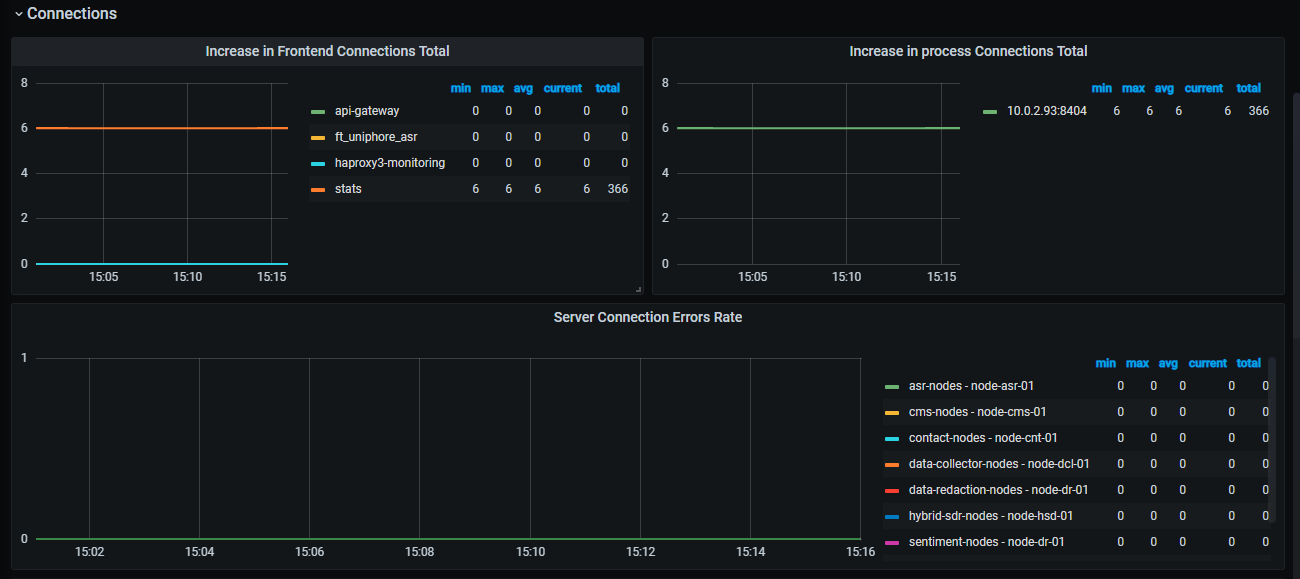
Increase in frontend connections total - Increase in the total where frontend connects haproxy
Increase in process connection total - Increase in the total connection of whole Haproxy process
Server connection errors rate - Increase in the total errors of the whole server
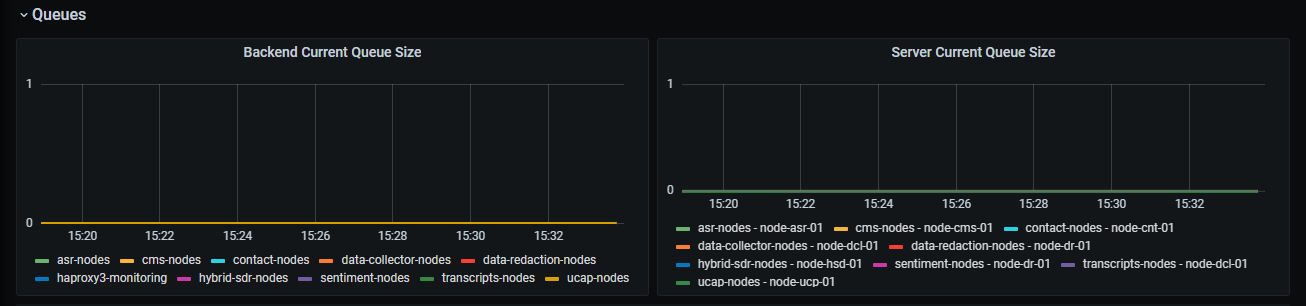
Backend current queue size - No of client connections which are queued for backend service
Server current queue size - No of client connections whic are queued, visualized service and instance(node) wise
Frontend current sessions - Increase the number of frontend sessions( end-to-end)
Backend current sessions - Increase the number of backend connections being established to server
Frontend max sessions - Increase in the number of observed active frontend connections
Server max sessions - Increase in the number of observed active server connections