Postgres Monitoring
Postgres needs an export er to scrape the metrics to prometheus and following is the command to run and create the postgres exportercontainer:
docker run -d --name postgres-exporter --net=host -e DATA_SOURCE_NAME="postgresql://postgres:Un190re@769163@18.216.167.150:5432/aumina?sslmode=disable" wrouesnel/postgres_exporter
Replace the connection string in the above command.
Default port for the postgres exporter is 9187. So, once the postgres-exporter docker service is up, user can get the metrics using
curl http://127.0.0.1:9187/metrics
Once we get the metrics, add the the following in prometheus.yml (/etc/prometheus/prometheus.yml) and restart the prometheus docker container:
- job_name: 'postgres'
metrics_path: '/metrics'
scrape_interval: 5s
static_configs:
- targets: ['172.31.36.120:9187']
Login to Grafana and import custom dashboard (PostgreSQL Database.json) for Postgres.
 |
The metrics that follow are visualized in Grafana dashboards:
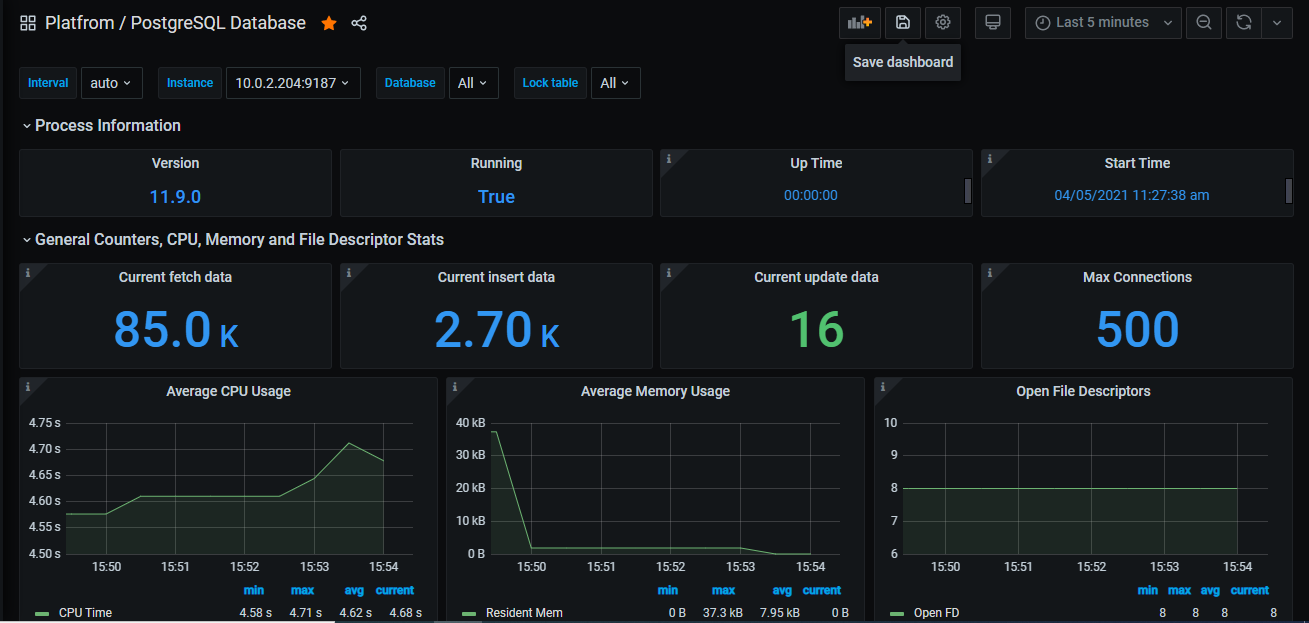
Process information
Version - Postgres Version
Running - Running Status True/False
Uptime - Relative time since when the service is up
Start time - Service start data and time

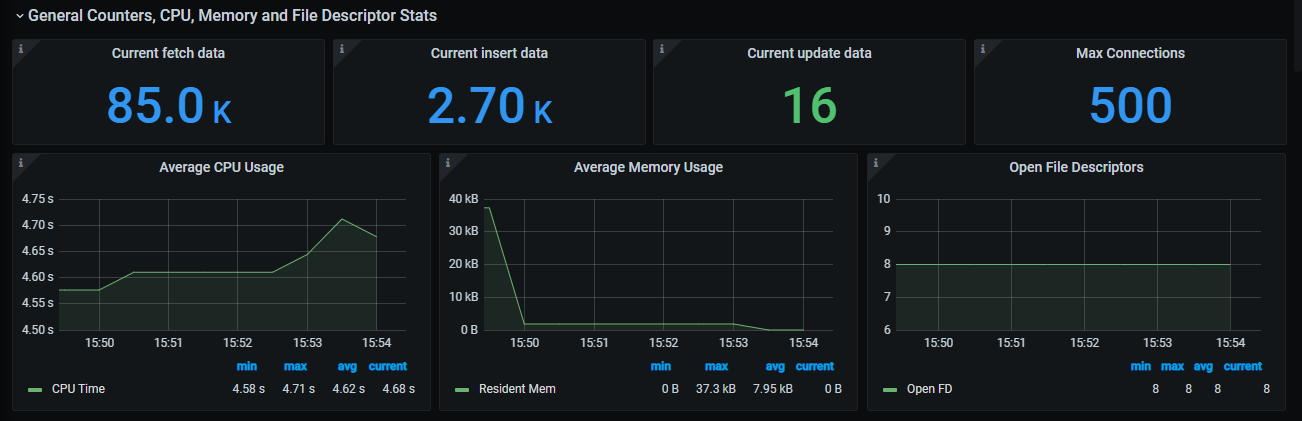
General Counters, CPU, Memory and File descriptor statistics
Current fetch data - Sum of rows fetched by queries till now
Current insert data - Sum of rows inserted till now
Current update data - Sum of rows updated till now
Max connections - Maximum number of concurrent connections
Average CPU Usage - Average user and system CPU time spent in seconds
Average Memory Usage - Virtual and Resident memory size in bytes, averages over 5 min interval
Open File Descriptors - Number of open file descriptors
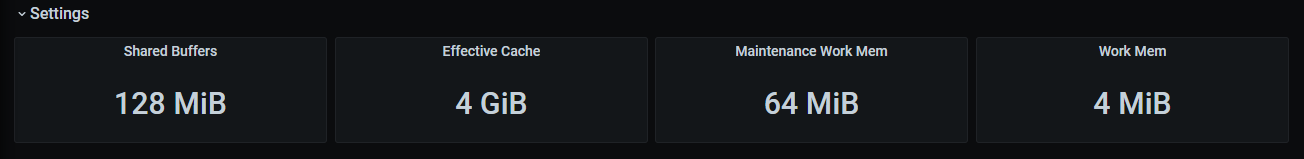
Settings
Shared buffers - Parameter determines how much memory is dedicated to the server for caching data.
Effective Cache - Parameter estimates how much memory is available for disk caching by the operating system and within the database itself
Maintainace work memory - parameter basically provides the maximum amount of memory to be used by maintenance operations like vacuum, create index, and alter table add foreign key operations.
Work memory - parameter basically provides the amount of memory to be used by internal sort operations and hash tables before writing to temporary disk files
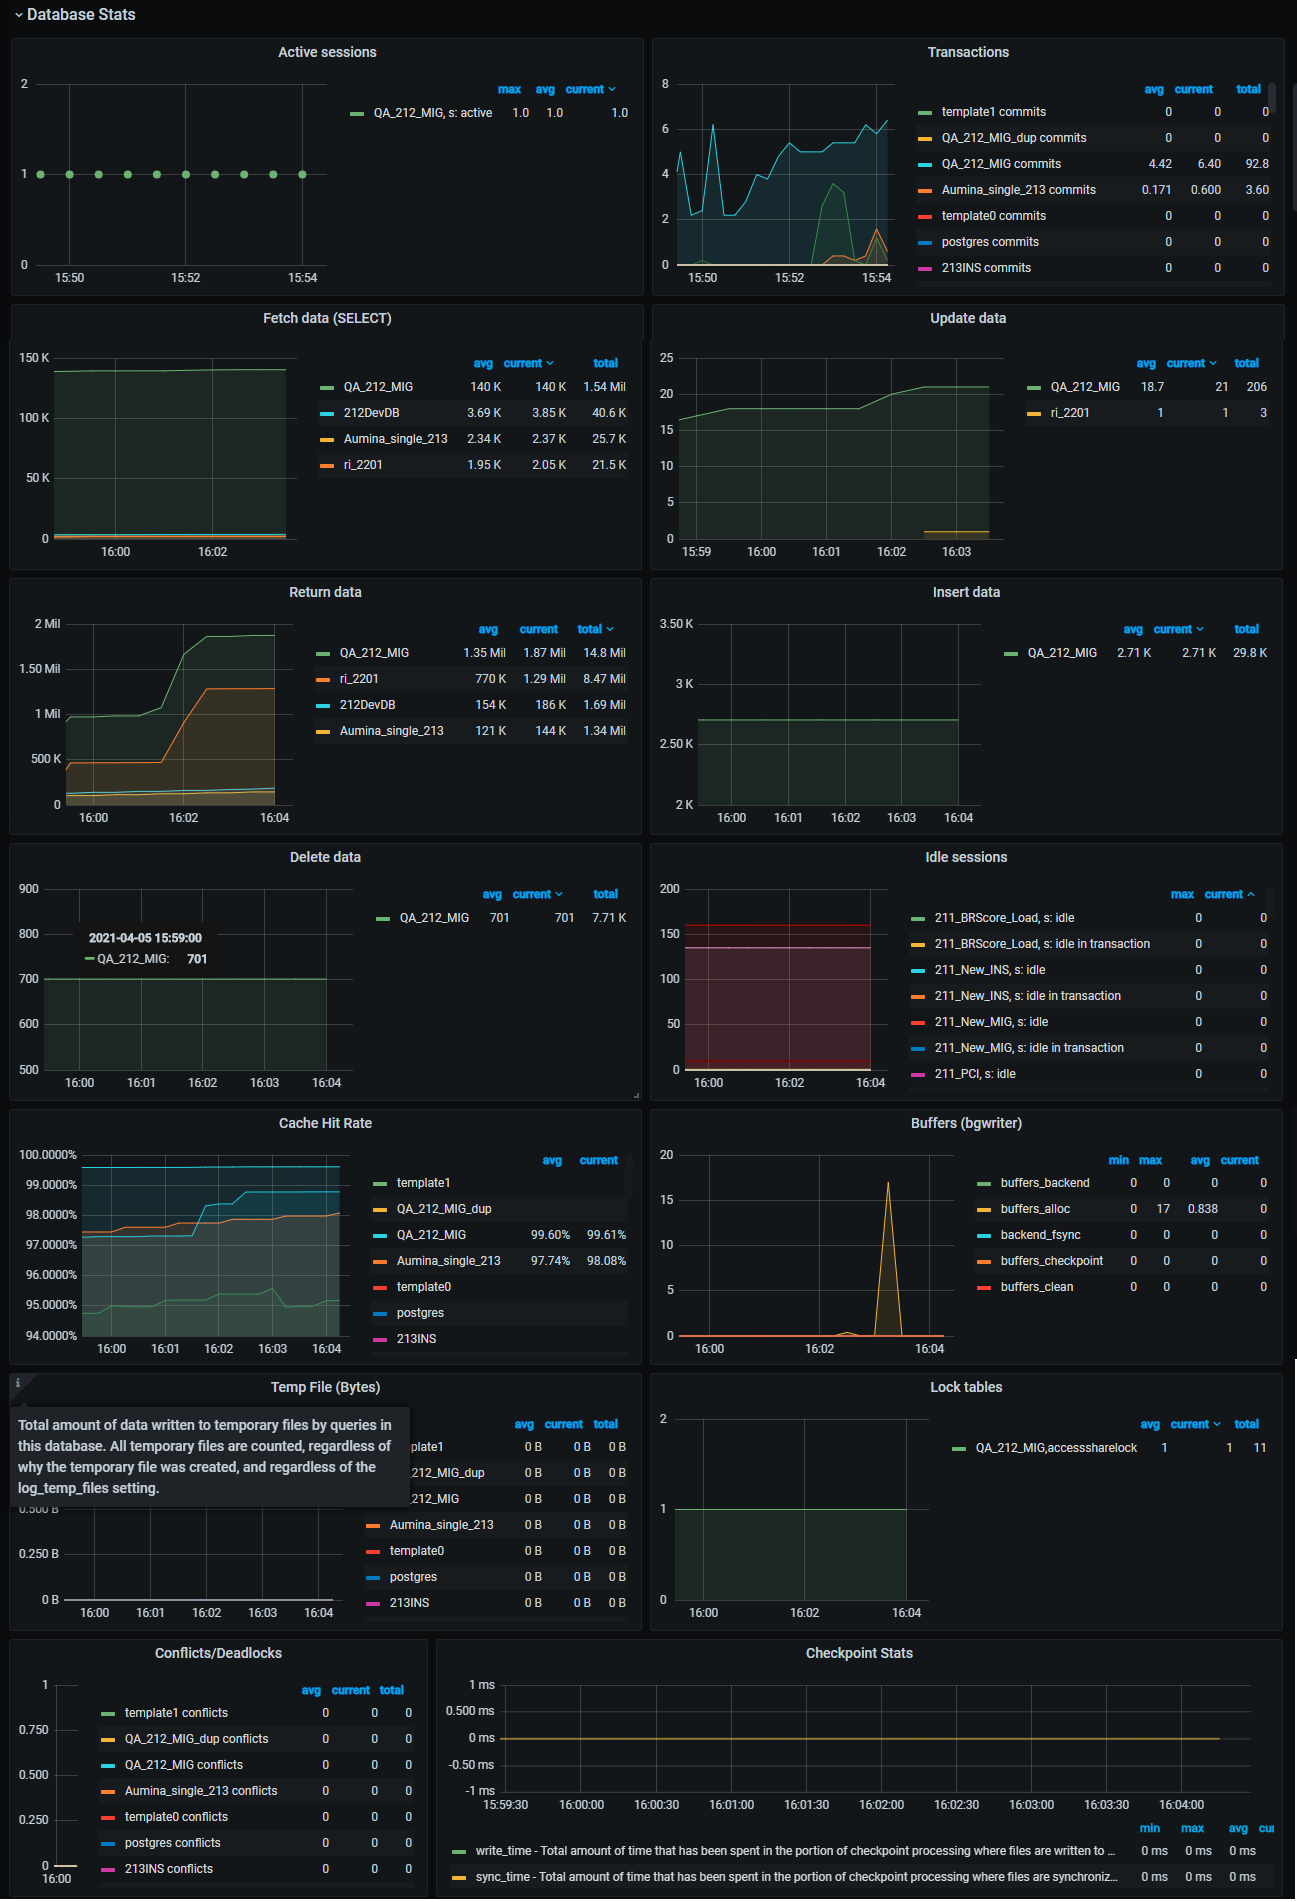
Database statistics
Active Session - Number of connections in the active state
Transactions - Rate of number of transactions in this database that are committed and rolled back
Fetch Data - Number of rows fetched by queries in this database
Update Data - Number of rows updated by queries in this database
Return Data - Number of rows returned by queries in this database
Insert Data - Number of rows inserted by queries in this database
Delete Data - Number of rows deleted by queries in this database
Idle Sessions - Number of connections in the idle state
Cache Hit Rate - Postgres itself actually tracks access patterns of your data and keeps frequently accessed data in cache. Generally, cache hit rate to be above 99%
Buffers(bgwriter) - Number of buffers written directly by a backend
Temp File(Bytes) - Rate of temp bytes written to the temp files
Lock tables - PostgreSQL provides various lock modes to control concurrent access to data in tables and it has various types of lock against a table
Conflicts/Deadlocks - One row per database, showing database-wide statistics about query cancels due to conflict with recovery on standby servers
Checkpoint stats - Total amount of time that is spent in the portion of checkpoint processing where files are written to disk, in milliseconds