Redis Monitoring
For Redis montioring we need to run an exporter to scrape the metrics from Redis and following is the command to pull the docker image and to run it:
docker pull oliver006/redis_exporter
docker run -d --name redis_exporter -p 9121:9121 oliver006/redis_exporter -redis.addr "redis://172.31.14.232:6379" -redis.password "password"
Please provide the password which is set for redis auth, along with -redis.password parameter.
Once redis-exporter docker service is running, user can get the metrics from
curl http://127.0.0.1:9121/metrics
9121 being the default port of exporter
Once we get the metrics, add /etc/prometheus/prometheus.yml following in prometheus.yml and restart the prometheus docker container:
- job_name: 'redis'
metrics_path: '/metrics'
scrape_interval: 5s
static_configs:
- targets: ['172.31.36.120:9121']
Login to Grafana and import custom dashboard (Redis.json) for Redis.
 |
The metrics that follow are visualized in Grafana dashboards:
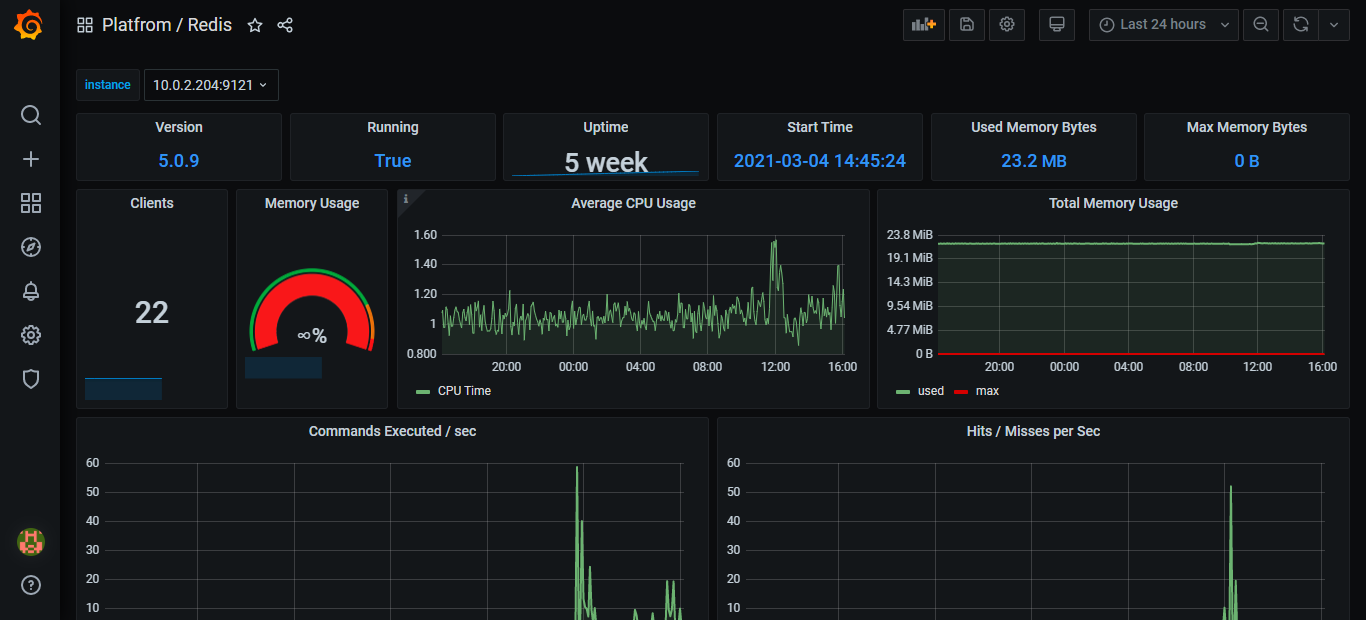
Process information
Version - Installed Redis version
Running - Current running state True/False
Uptime - Relative up time of redis
Start time - Start time of redis
Used memory bytes - Number of used memory bytes
Max memory bytes - Max memory bytes assigned ( in /etc/redis.conf )

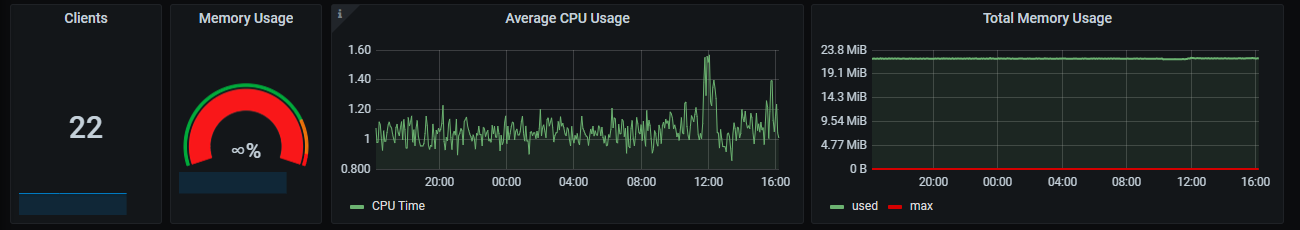
CPU, Clients and Memory Usage
Clients - Number of connected clients
Memory Usage - Memory usage percentage(Max memory to be set )
Average CPU Usage - Average user and system CPU time spent in seconds
Total Memory Usage - Trend of memory usage
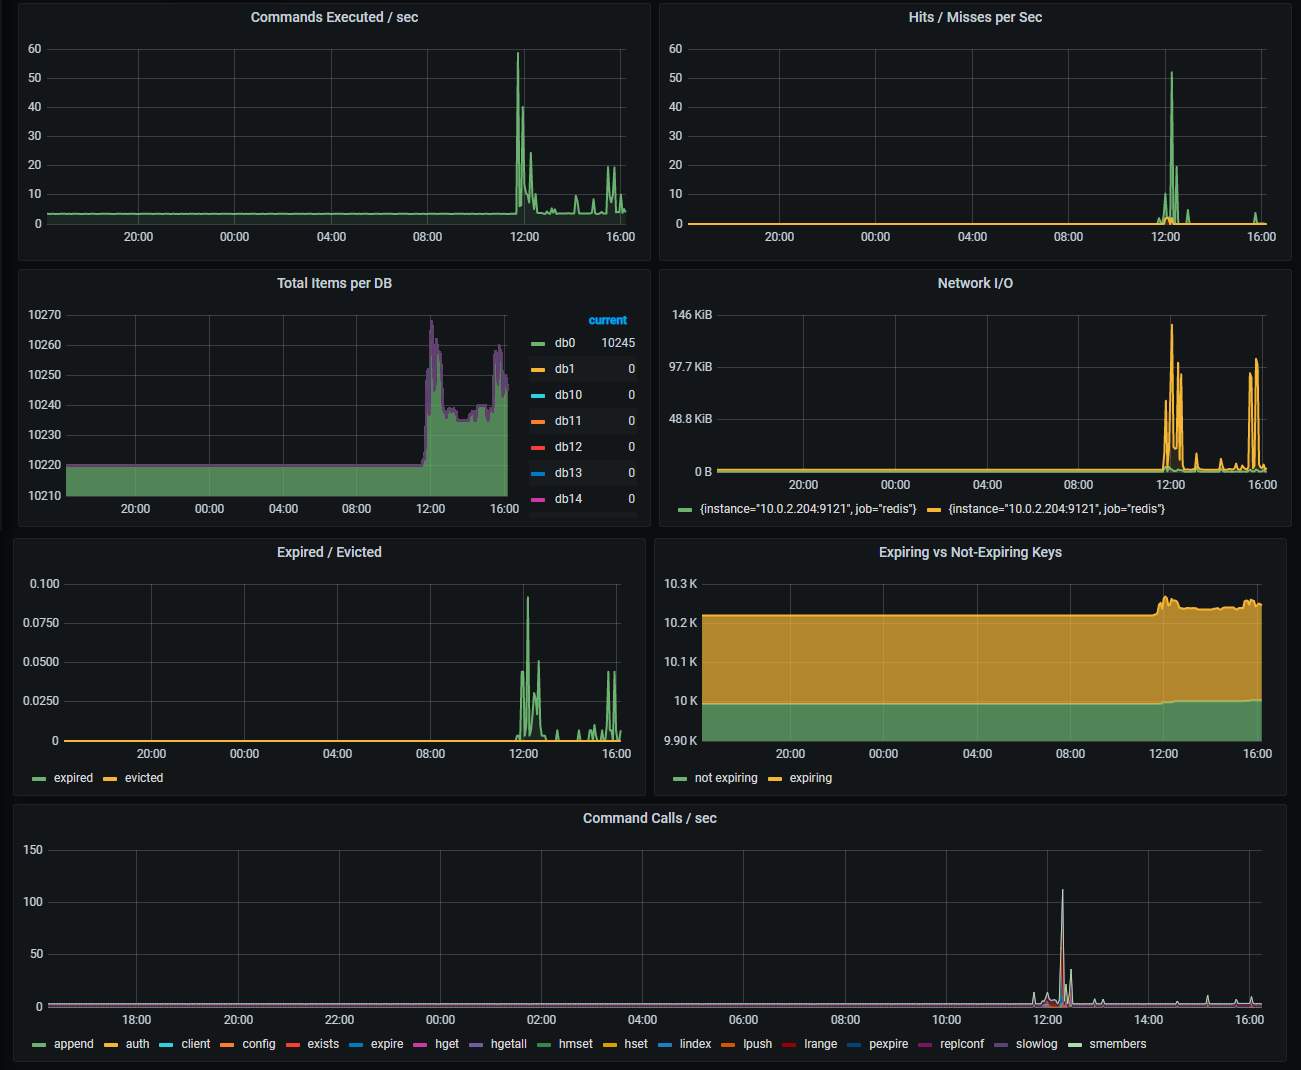
Statistics
Commands Executed / Sec - Total number of commands processed
Hits / Misses per sec - Trend of cache hits and cache misses
Total Items per DB - Total number of keys per DB
Network I/0 - Trend of input bytes total and Output bytes total
Expired / Evicted - Trend of total expired keys and total evicted keys
Expiring vs Not-Expiring Keys - Trend of expiring keys and non-expiring keys (total db keys - expiring keys)
Command calls / sec - Total number of commands per sec