Kafka Monitoring
The exporter which we are using for Kafka monitoring gives information about lags. The messages are in/out, message consumed and partitions. Unlike other exporters, this doesn’t expose the metrics about Kafka process information.
Add the snippet that follows in Kafka docker compose file to create a docker container for Kafka exporter:
kafka-exporter:
container_name: kafka-exporter
image: registry.uniphore.com/uniphore/third-party/kafka-exporter:latest
ports:
- 9308:9308
extra_hosts: *default-extra_hosts
command: --kafka.server=172.31.36.120:9092
Note
Change the host and other environment specific values in the above command.
*default-extra_hosts - is the list of hosts which are added in docker compose file.
Once the Kafka-exporter's docker container is running, user gets the metrics from:
curl http://127.0.0.1:9308/metrics
Once you get the metrics, add (/etc/prometheus/prometheus.yml) in prometheus.yml
Restart the Prometheus docker container.
- job_name: 'kafka'
metrics_path: '/metrics'
scrape_interval: 5s
static_configs:
- targets: ['172.31.14.232:9308']
Login to Grafana and import custom dashboard for Kafka.
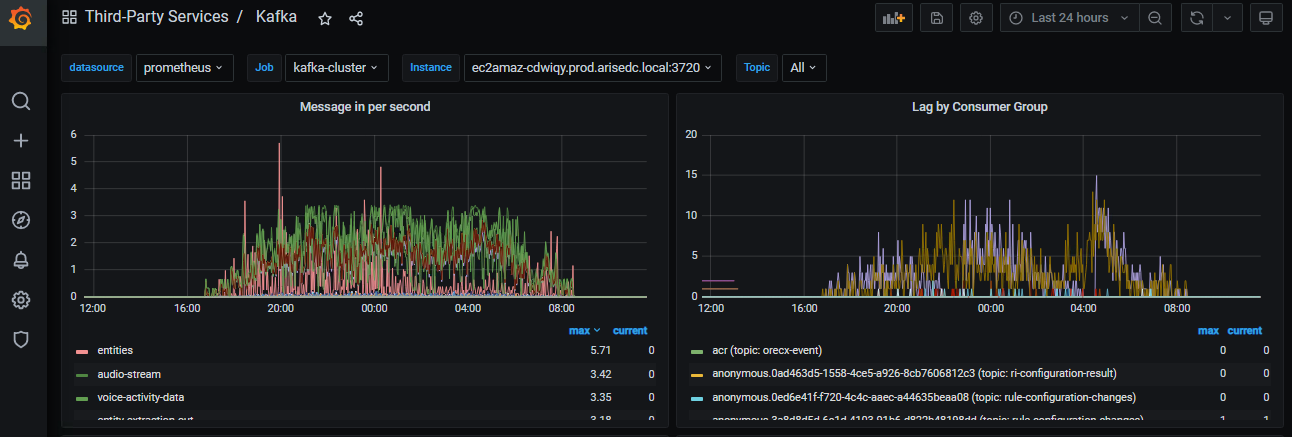
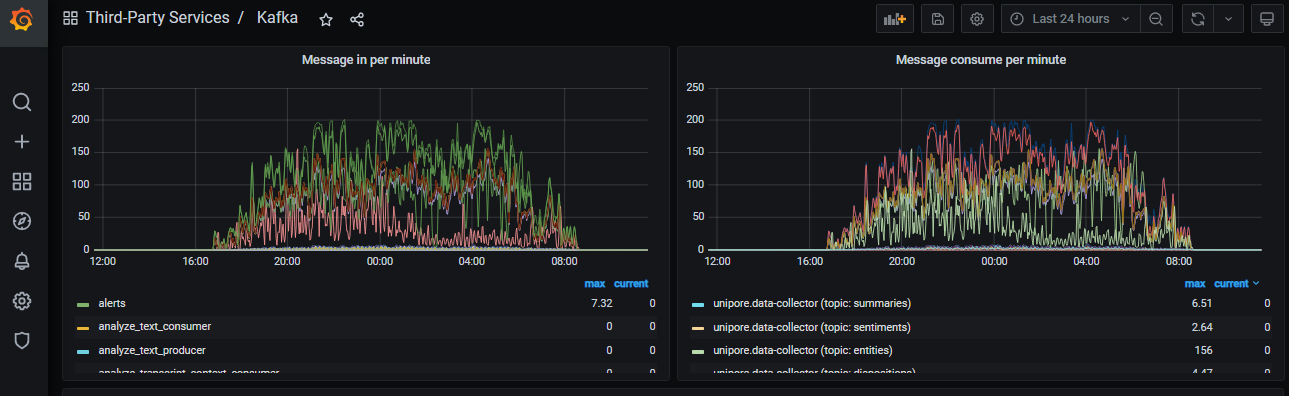
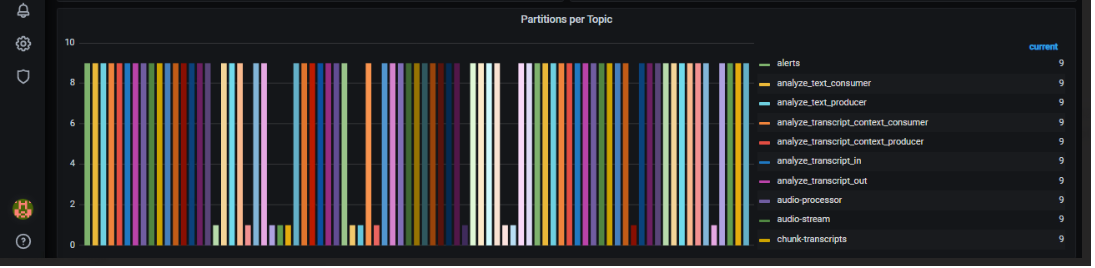
The metrics that follow are displayed in Grafana dashboards:
Message in per second - Total number of messages coming in per second.
Lag by consumer group - Lag data filtered by consumer group with topic information in the legend.
Message in per minute - Total number of messages coming in per minute
Message consumed per minute - Total number of messages consumed per minute
Partitions per topic - Total number of partitions listed by topics.
 |
 |
 |