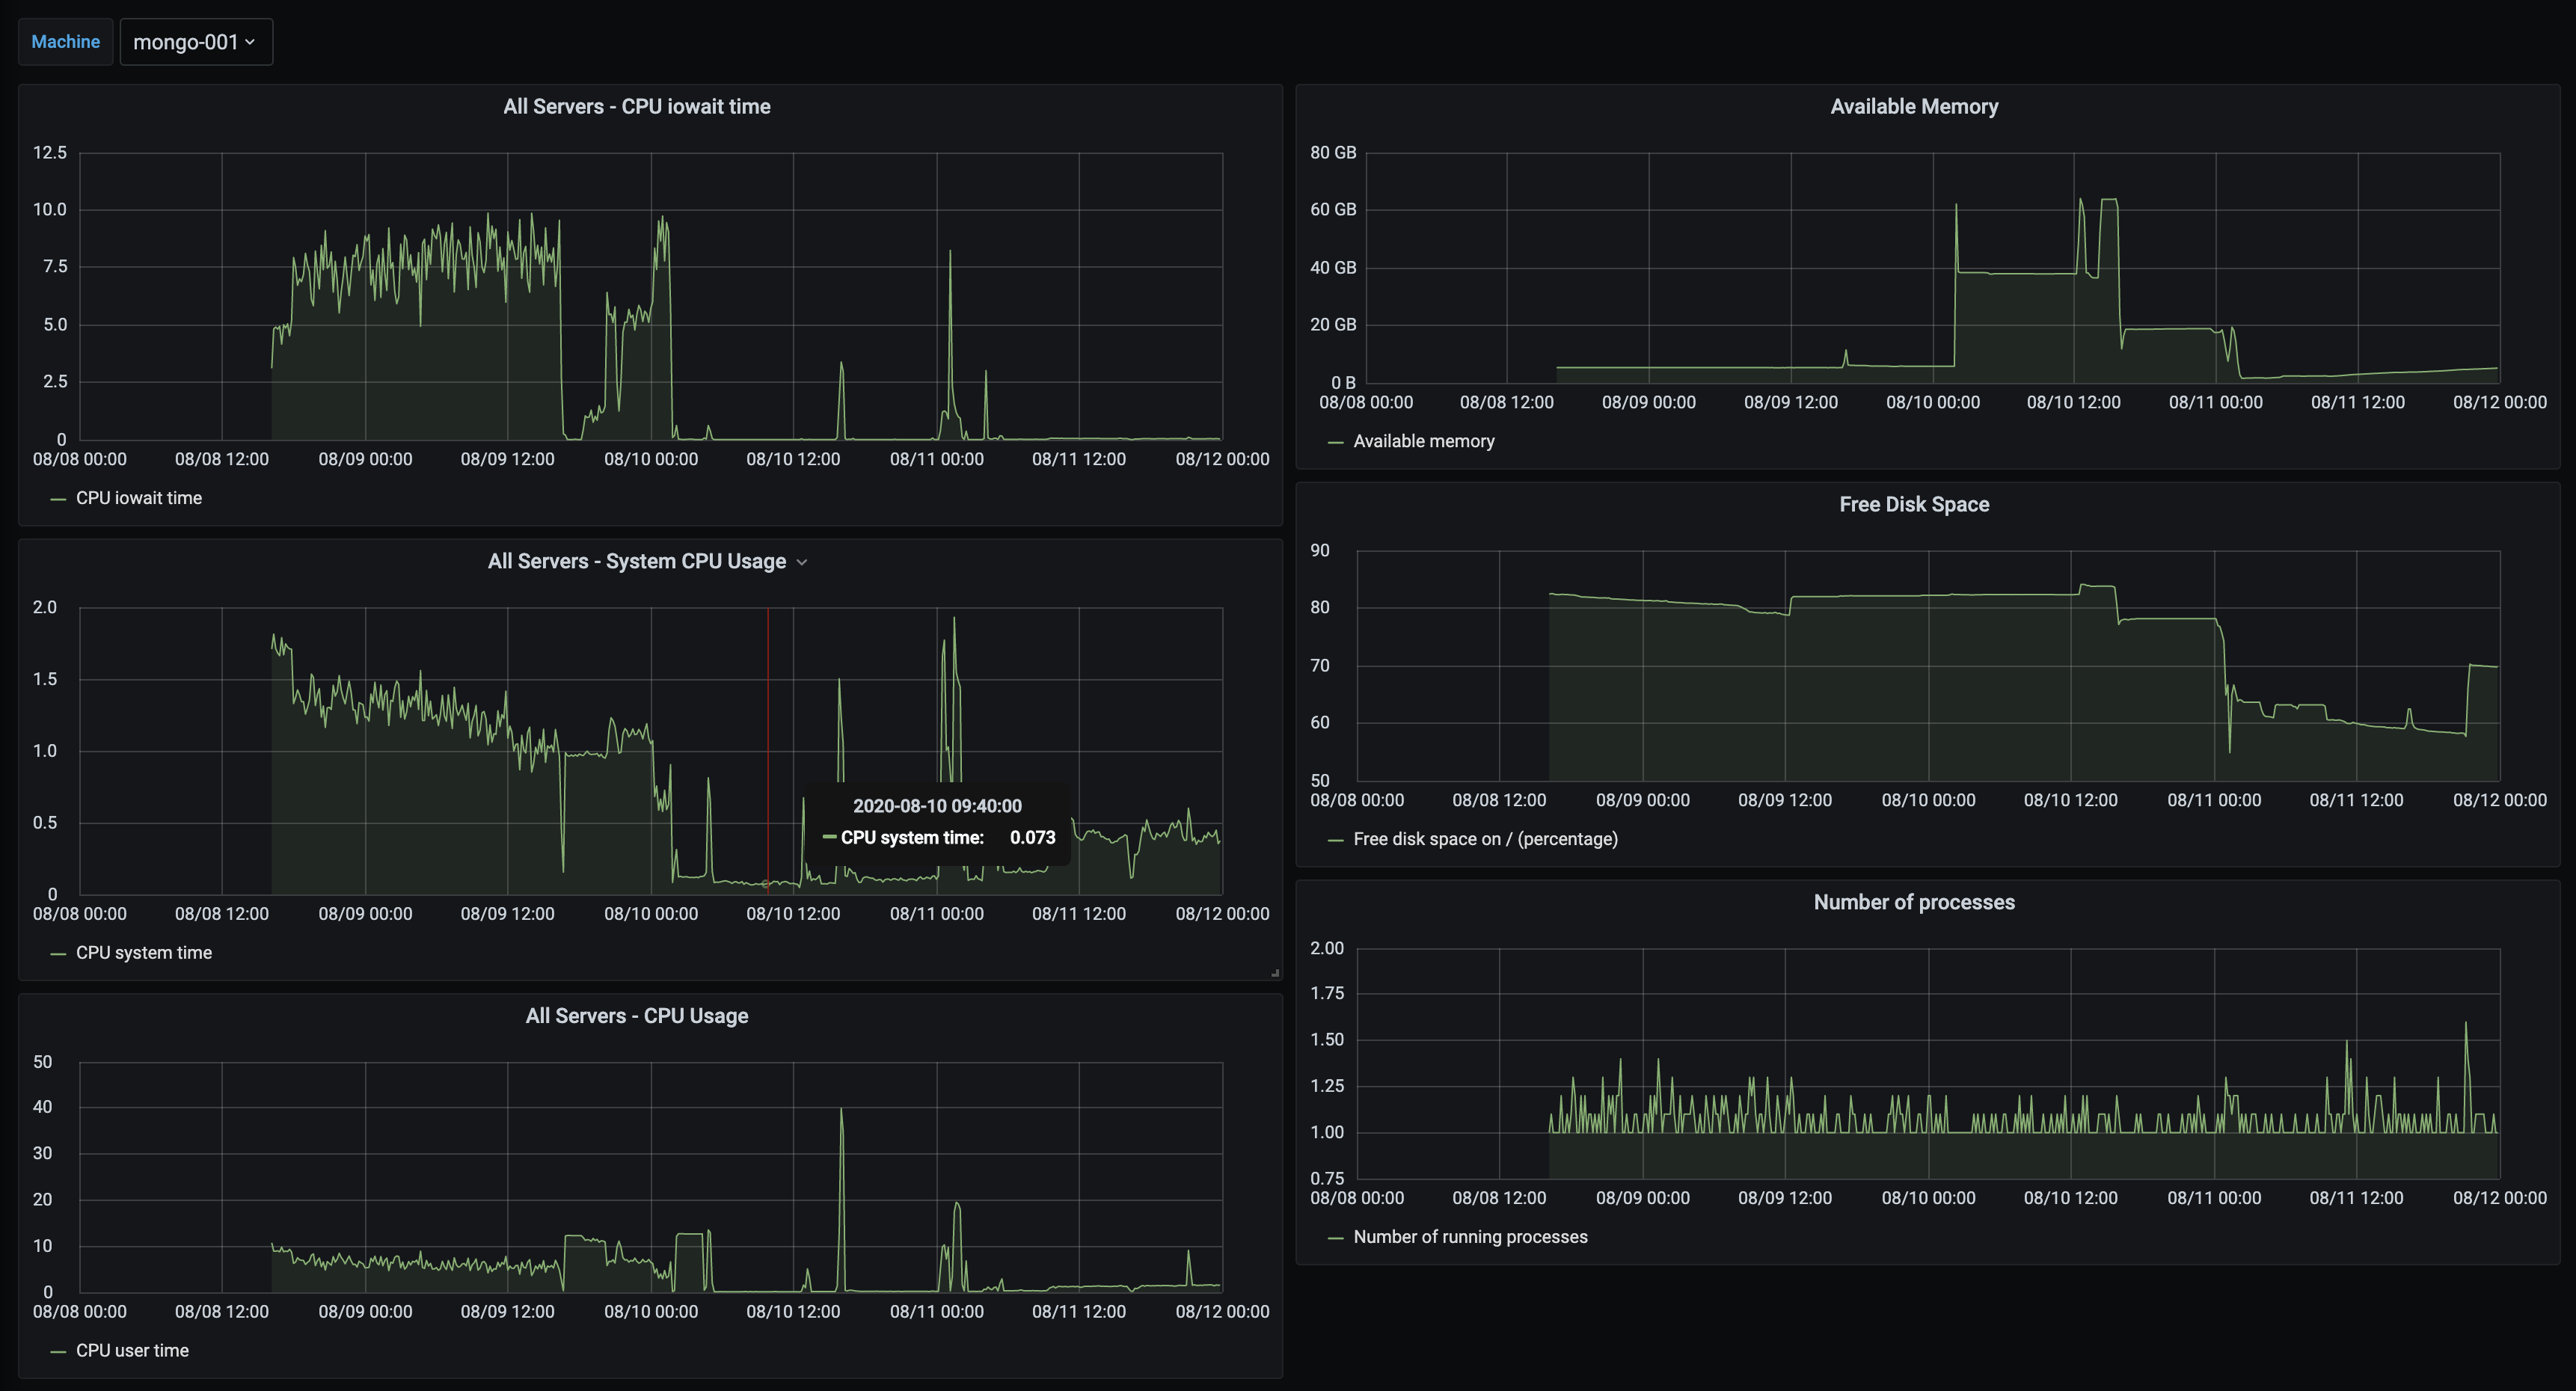
Virtual Machine Metrics
Monitor any possible server performance metrics through Zabbix and export host metrics and visualize data from Grafana.
Server performance
High CPU or memory utilization
Network bandwidth usage
Packet loss rate
Server availability
Free disk space is low
System status is in warning/critical state