Platform Service Metrics
Instrumenting JVM-based applications using Micrometer is a dimensional-first metrics collection facade whose aim is to allows us to time, count, and gauge code with monitoring systems like Prometheus to export metrics data. The platform services (Java and Go) publish process metrics to Prometheus.
The following metrics are exported from the platform services:
Process Overview
Start Time
Uptime
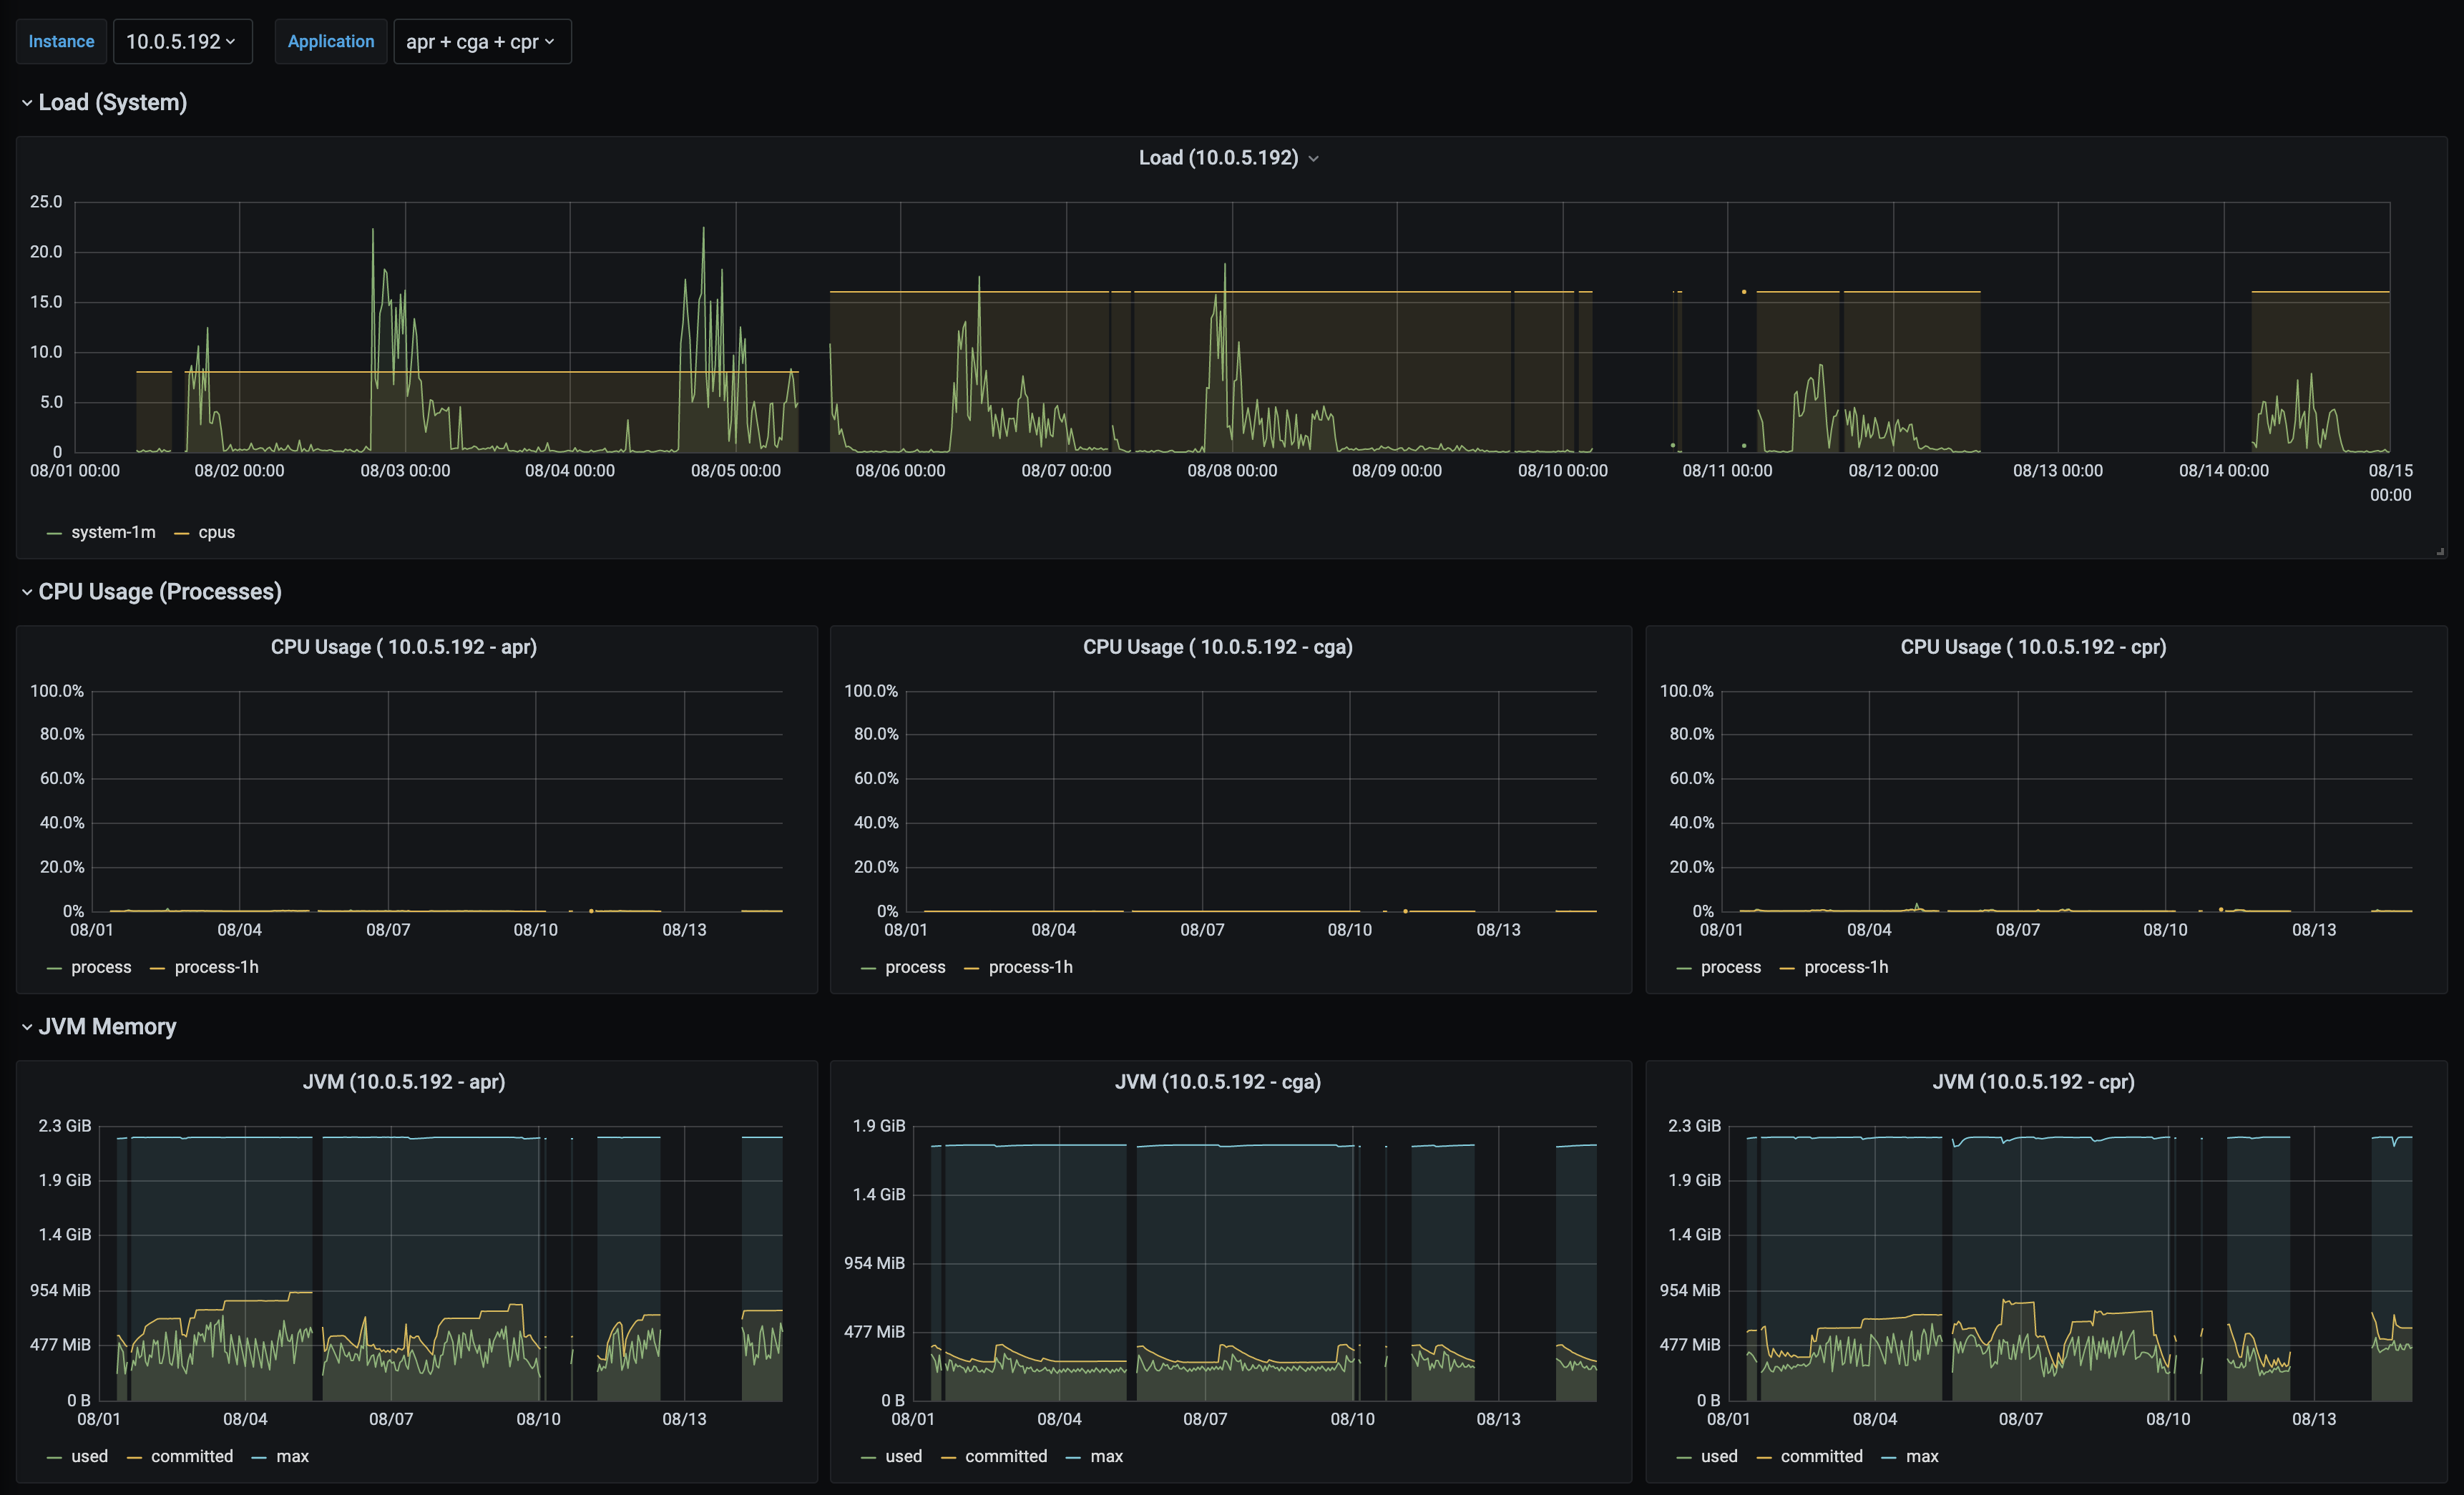
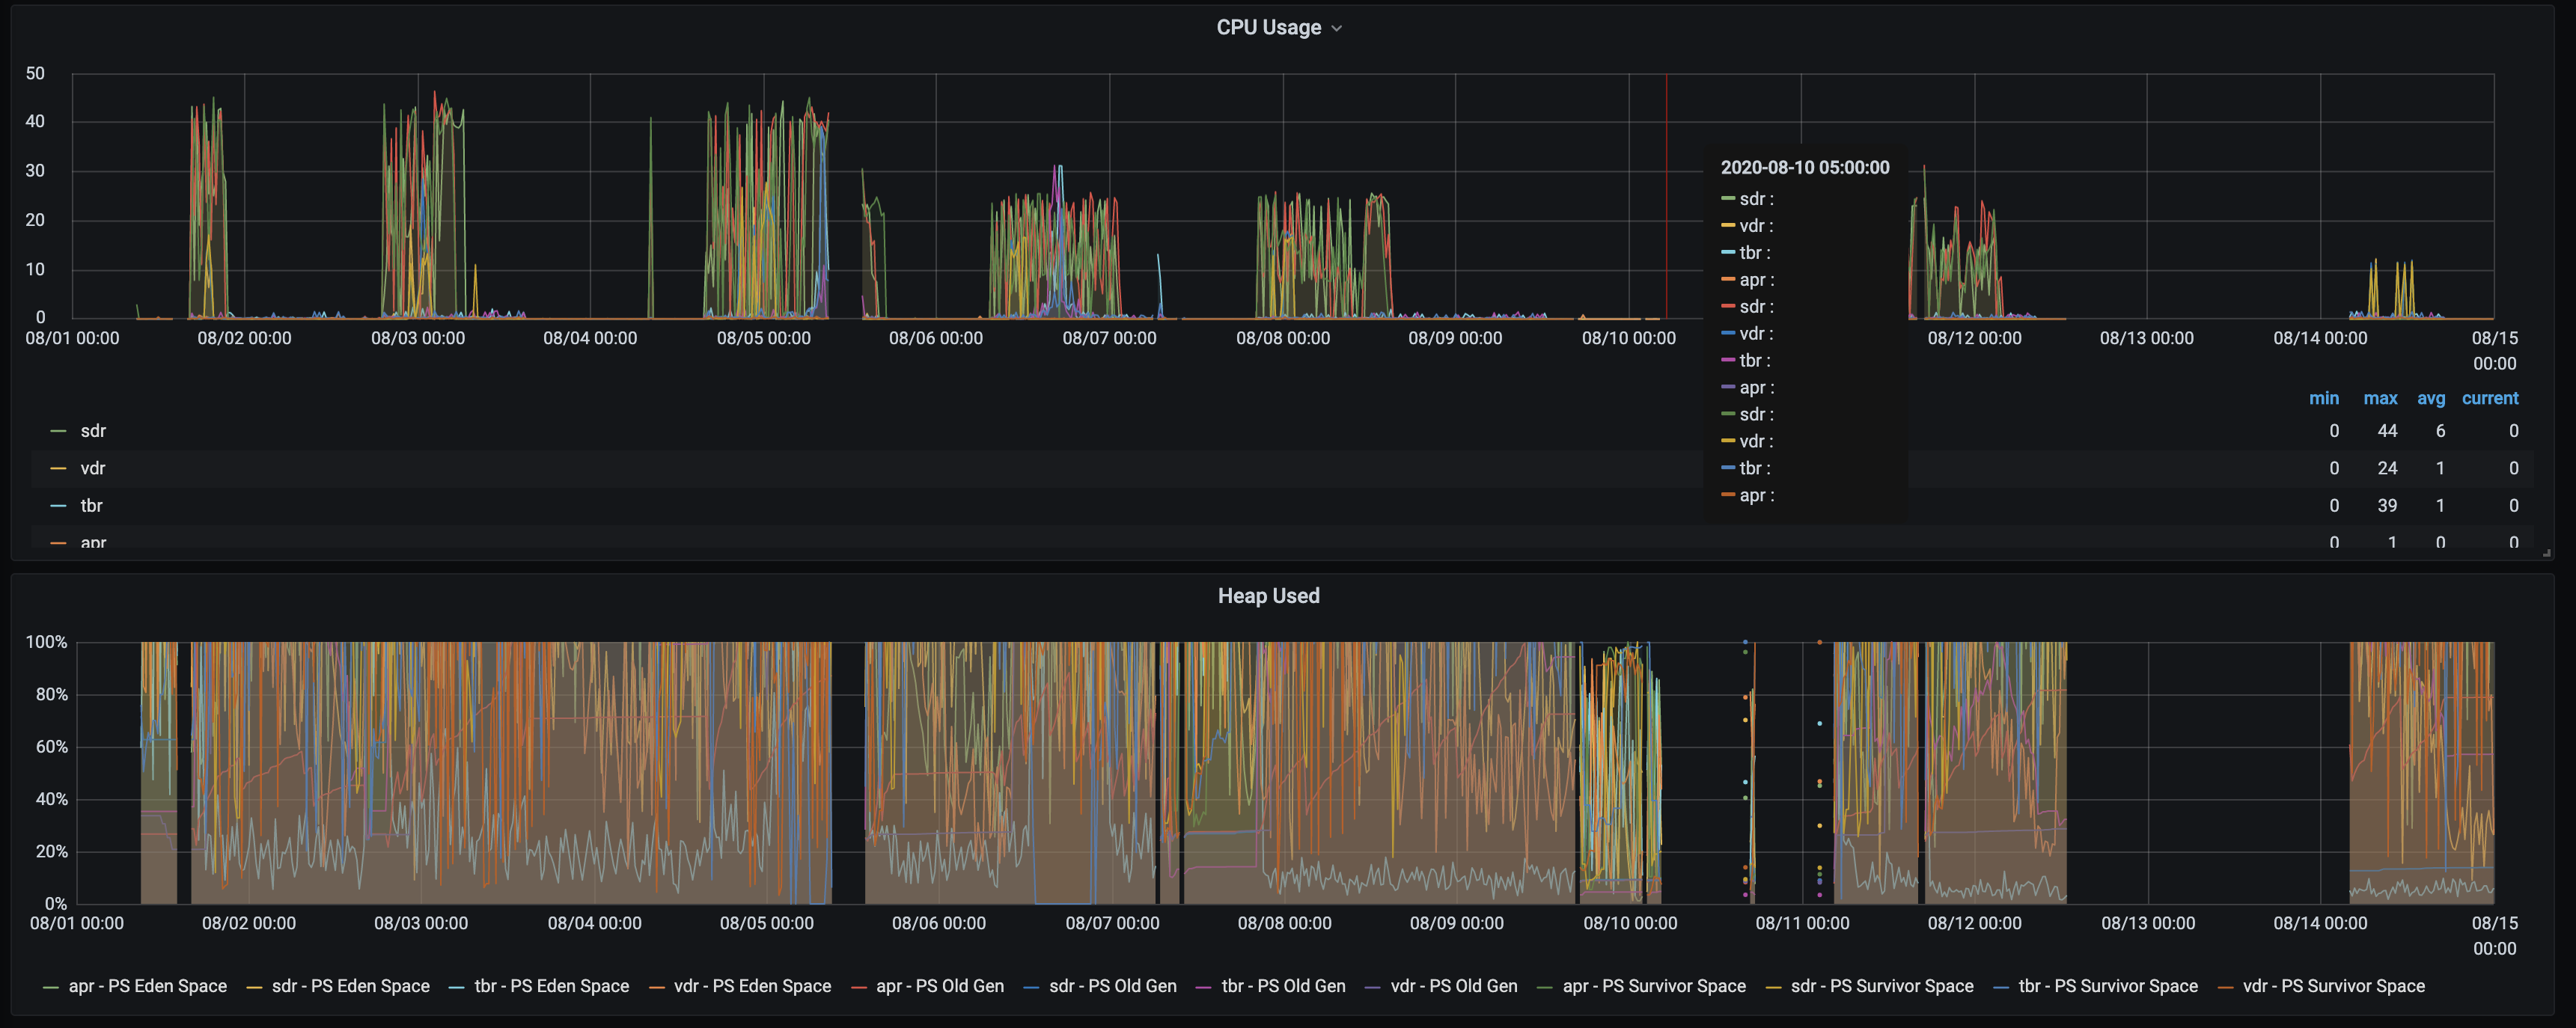
Heap Utilization
CPU Utilization
I/O Overview
Rate
Errors
Duration
JVM, report utilization of
Various memory and buffer pools
Statistics related to garbage collection
Thread utilization
Number of classes loaded/unloaded
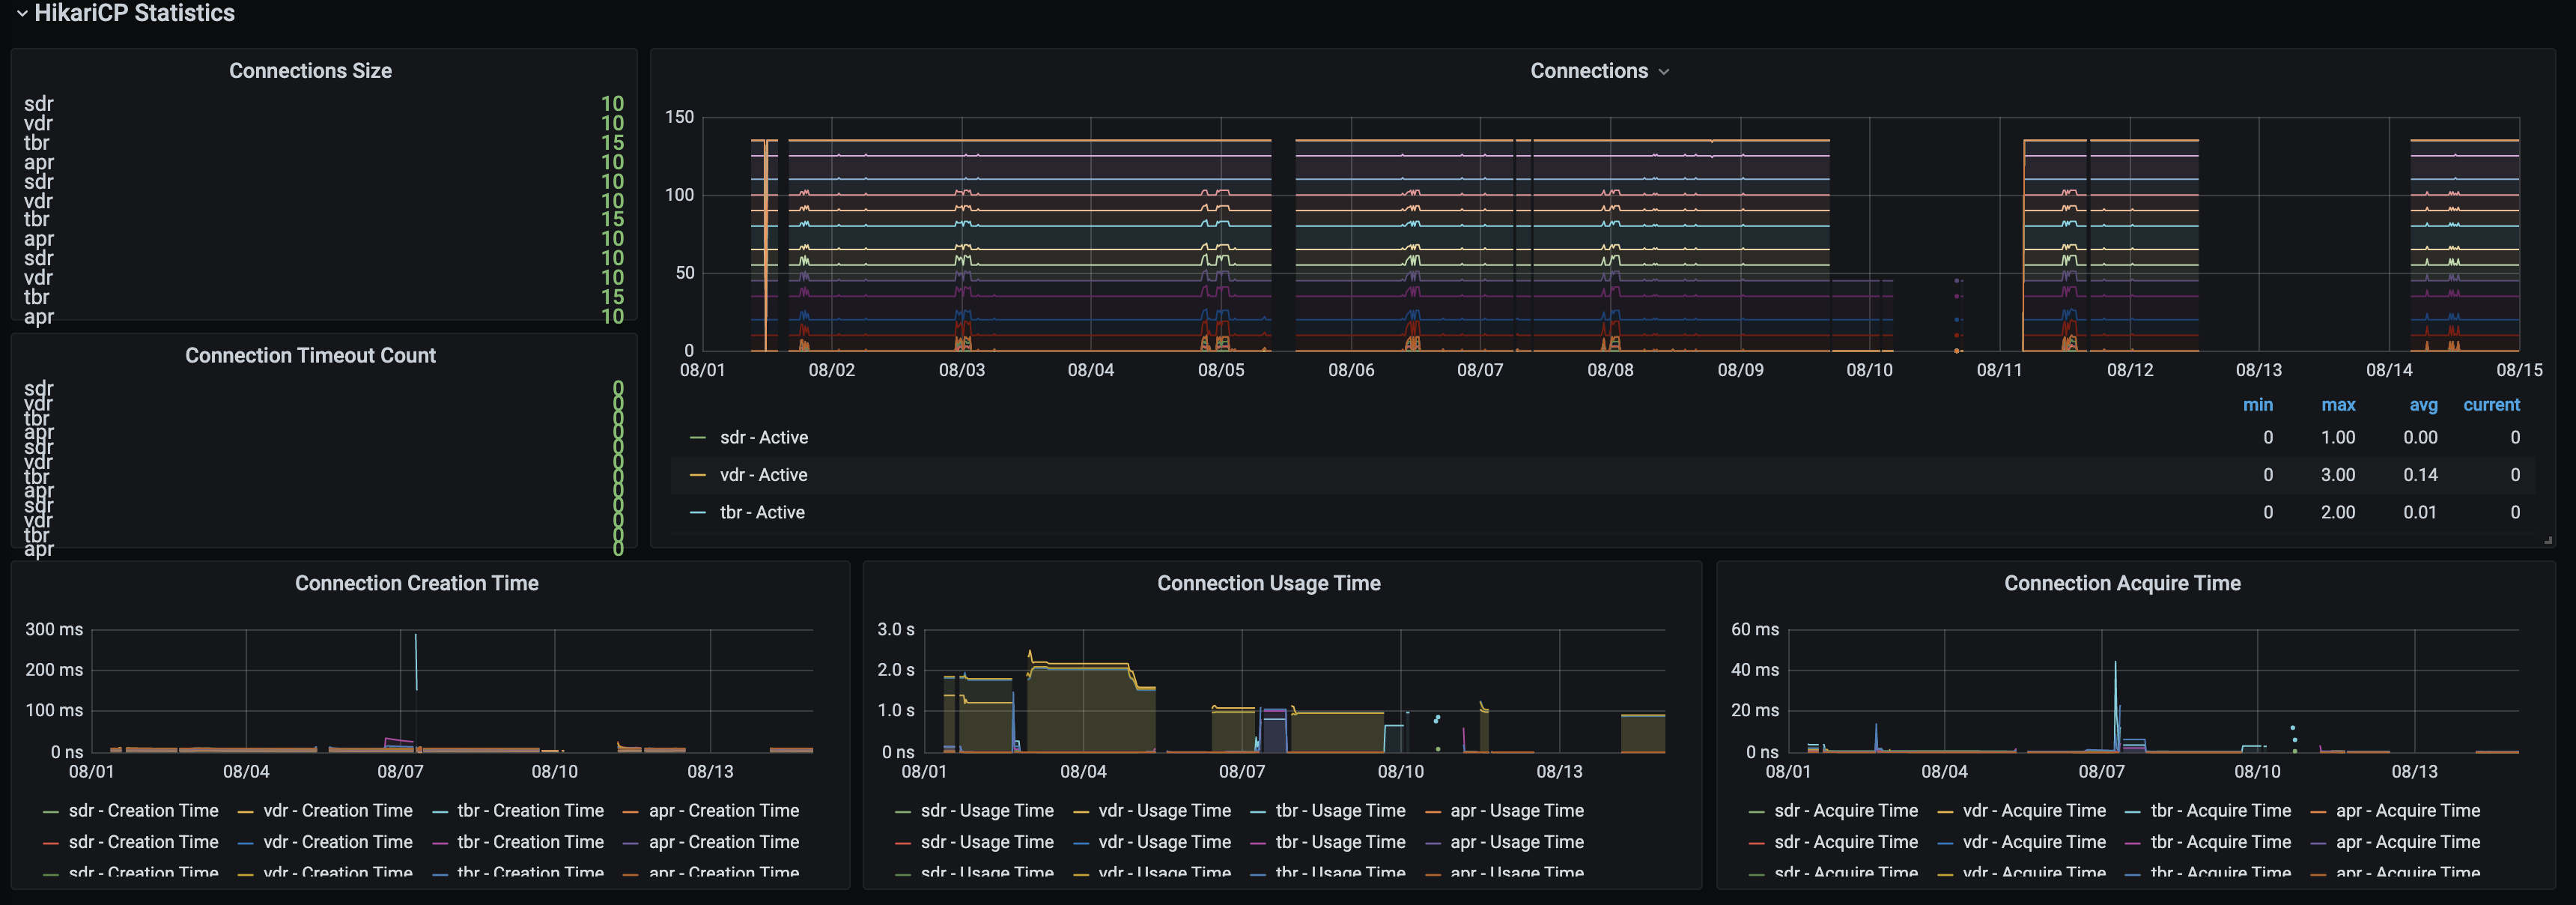
Datasource utilization, including HikariCP pool metrics
File descriptor usage
HTTP Request latencies
Request Count
Response Time