X-Platform Reporting
Getting Started with X‑Platform Reports
X‑Platform Reports provide you with the data and visualizations that enable key operational insights specific to your business needs.
Note
All X‑Platform Reports are accessed using the X-Console.
A Raw Data report displays the values of variables and/or questions used in a selected Interaction. Raw Data reports are useful for:
Generating information that is required by third-party organizations (e.g., payment authorities)
Generating required audit reports
Integrating data with your organization's Business Intelligence tool
Variable/Question values of all instances of the Flow run during a specific time period are shown in a Raw Data report. When you build the report, you define which variables/questions will be included in the report data. Any combination of variables and questions may be selected, allowing you to customize each Raw Data report to different analysis needs. For example, one report may show information about customer feedback, and another may show data about the types of devices on which the Flow was run.
For more information about using raw data reports, click here.
Understanding the Reports Page
You use the Reports page to create X‑Platform reports and to view, update, run and manage them.
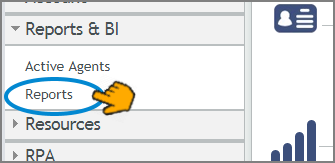
To access the Reports page, click Reports from the Reports & BI menu of the X-Console:
 |
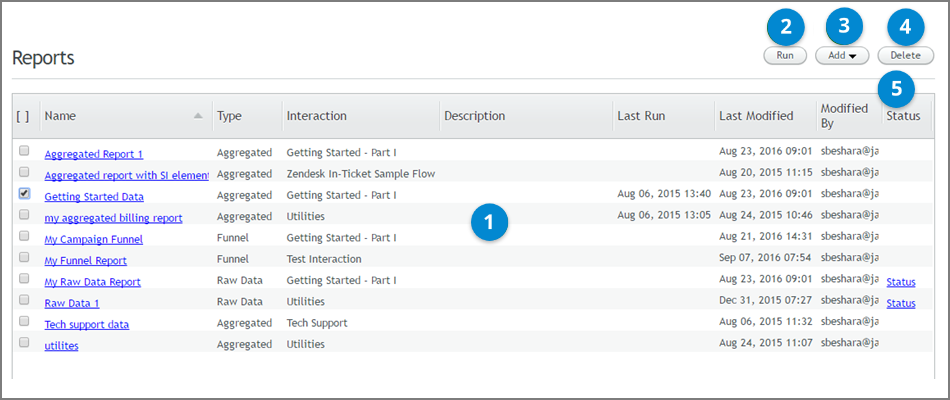
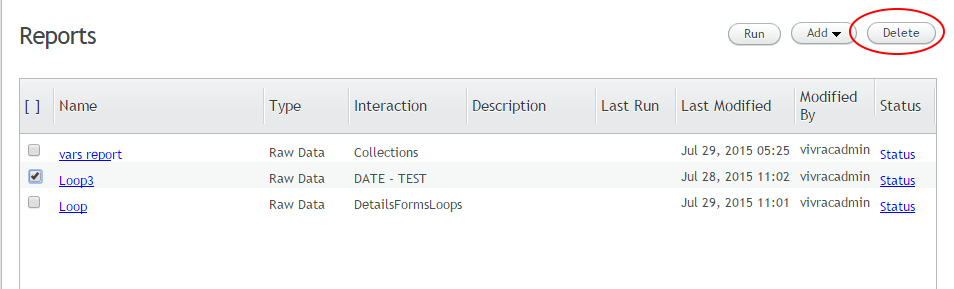
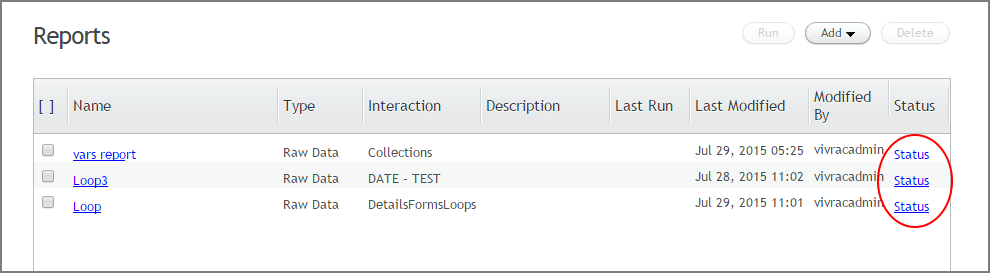
The main features of the Reports page are shown and described below:
 |
Item | Feature | Description |
|---|---|---|
1 | Reports Listing | Provides general information about each report that has been defined, such as the Flow involved and when the report was last run. Clicking the link in the Name column opens the Report Details page from which you can view and update the report's metadata and queries. |
2 | Run | Runs the report selected in the checkbox. For more information, refer to Running Reports. |
3 | Add | Enables you to create a new report. For more details, see the section for the specific report type that you wish to create. |
4 | Delete | Deletes one or more reports. For more information, refer to Deleting Reports. |
5 | Status | Opens the Report Status page, which allows you to view instances of reports that have been generated and to download reports that have run successfully. NoteThe Status link is available for Raw Data report types only. |
Running Reports
You run an X‑Platform Report by selecting the desired report from the Reports page and indicating the timeframe you wish to report on. For example, a report might return the information collected from the past week, or for one specific day during the previous month.
Raw Data reports include data collected during the past 24 hours.
Note
All X‑Platform Reports are run from the X-Console.
To run raw data reports successfully, a report must contain at least one query. Before attempting to run the report, verify that the queries are defined as required. (For details, refer to Creating a Raw Data Report.)
Reports can be run from either the Report page or the Report Details page. The following procedure explains how to run a report from the Reports page. To generate a report from the Report Details page, begin with Step 2.
From the left side of the Reports page, select the checkbox in the row of the relevant report.
At the upper right side of the page, the Run button is enabled.
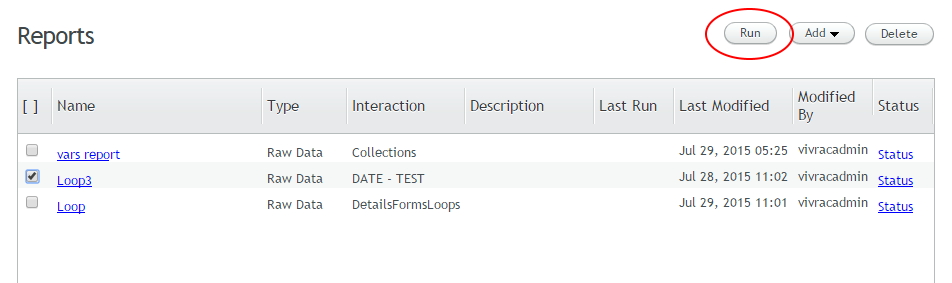
Click Run.
The Run Report popup opens.
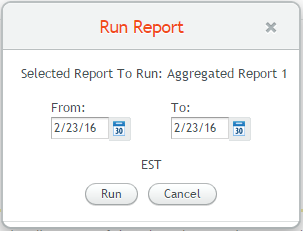
To change the From and/or To date, click the relevant date picker icon. Then, from the Calendar window that pops up, navigate to and select the required date.
Verify that the time zone displayed under the calendar icons is relevant to your working environment. If necessary, change the time zone by updating the setting on the Account Information page.
Note
Flow data is collected in the X‑Platform databases and aggregated into 24-hour periods according to UTC time. When a request to run a report is received, the relevant 24-hour period in UTC time is automatically adjusted forward or backward to accommodate the time difference between UTC and the user-selected time zone.
Click Run. The report runs, and the Report Status page for the relevant Flow opens on a new page.
When viewing report results, keep in mind that if the name (or variable type) of an element was changed after the report query was defined, the new name is automatically displayed in the report. In the event that no data exists for the new element name, data for the old element name is displayed.
Deleting Reports
The Delete function enables you to remove unnecessary reports from your report set. Multiple reports may be deleted simultaneously.
Note
X‑Platform Reports are deleted from the Admin Console.
From the left side of the Reports page, select the checkbox(es) in the row(s) of the report(s) that you want to delete. To select all reports, click the checkbox in the column header.
At the upper right side of the page, the Delete button is enabled.
Click Delete.
A warning popup opens.
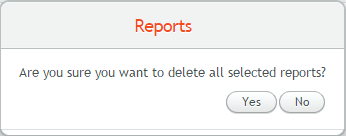
Click Yes.
A confirmation message is displayed. The selected reports are removed from the system.
Creating a Raw Data Report
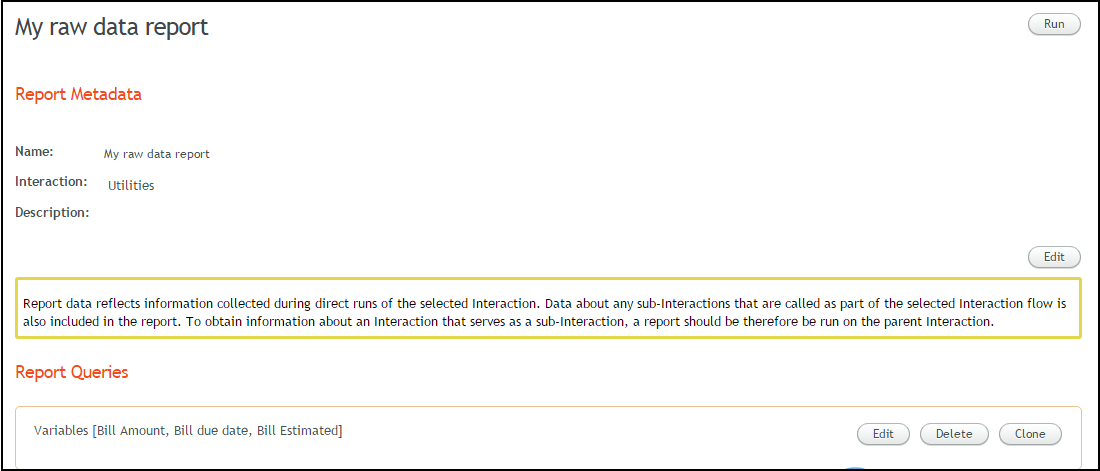
You create a Raw Data report by defining the following report components:
Report Metadata - The report name, the Flow to be analyzed, and optional notes about the report.
Report Queries - The variables and/or questions to be included in the report data.
Note
A new report can be saved after providing on the metadata. However, you will not be able to run the report until at least one query is defined.
From the Reports & BI menu in the X-Console, click Reports. The Reports page is displayed.
At the upper right corner of the page, select Add > Raw Data Report.

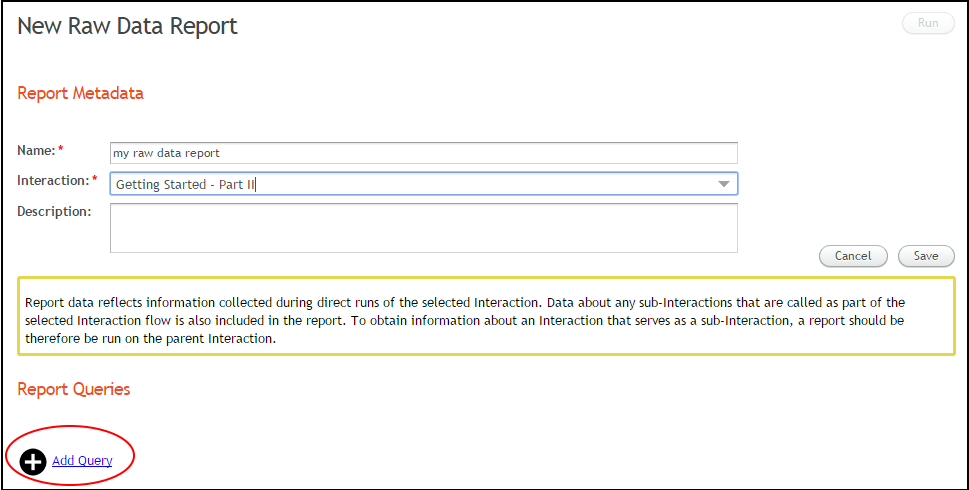
The New Raw Data Report page opens.
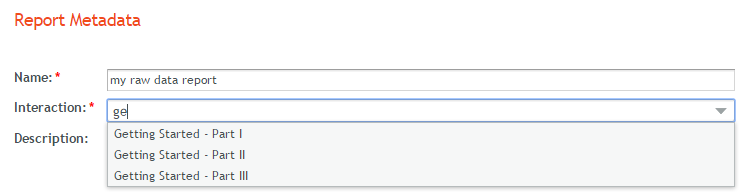
In the Name field, enter an appropriate name for the report. The report name must be unique (i.e., not used by any other report).
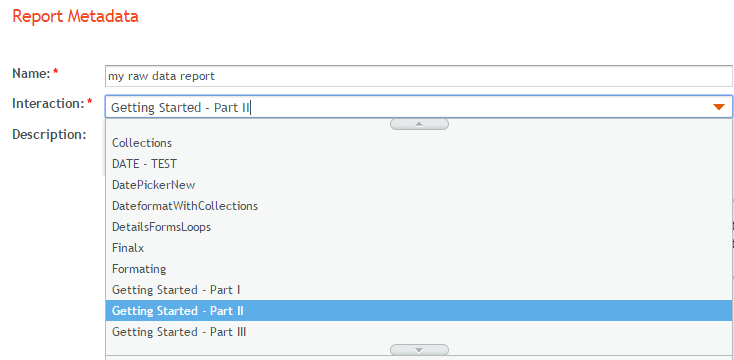
From the Interaction dropdown list, select the name of the Flow to be used as the basis for the report.
When the list is long, you can locate a specific Flow by entering a few letters from its name in the Search field.
The dropdown list includes Interactions in both Draft and Approved status.
When an Flow has been selected, the Add Query link (at the bottom of the page) is enabled.
If desired, in the Descriptionfield, enter relevant notes or comments about the report.
If the report you have selected contains Sub-interactions or Navigation Buttons which reference other Interactions, the Show Interaction Reference Elements dropdown list is displayed, as below.
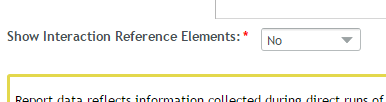
To obtain data about target Sub-Flow or Navigation Button activities in addition to the current Flow elements, select Yes. By default, the value of this dropdown is set to No, and queries will enable data reporting only on the current Flow elements.
Choose one of the following options:
Save the report without adding queries: On the right side of the page, click Save.
The Reports page appears, with the new report listed in the grid.
Continue building the report: Click the Add Query link, and add one or more queries. For details, refer to Adding Report Queries (below).
After a Raw Data report is created, its parameters can be changed at any time. For more details, click here.
Adding Report Queries to a Raw Data Report
You add a Report Query by selecting the variables and/or questions you want to query from a list displayed in the report building wizard. This list displays every variable and question in the selected Flow (except for questions related to secure password input).
This procedure describes how to add queries to a Raw Data report. For information about how to update existing queries, click here.
Note
Date queries for a Collection of Dates or a Custom Type containing Dates will always return dates in epoch format.
At the lower left corner of the page, click Add Query. If the Add Query link is disabled, verify that you have entered metadata for the report.
The Build Your Queries frame opens, listing every variable and question that is included in the selected Interaction.
If you include Referenced Interactions in your report, the relevant Steps will have their sources listed in the Referenced Interaction column.
The list may be sorted according to Name or Type, in ascending or descending order.
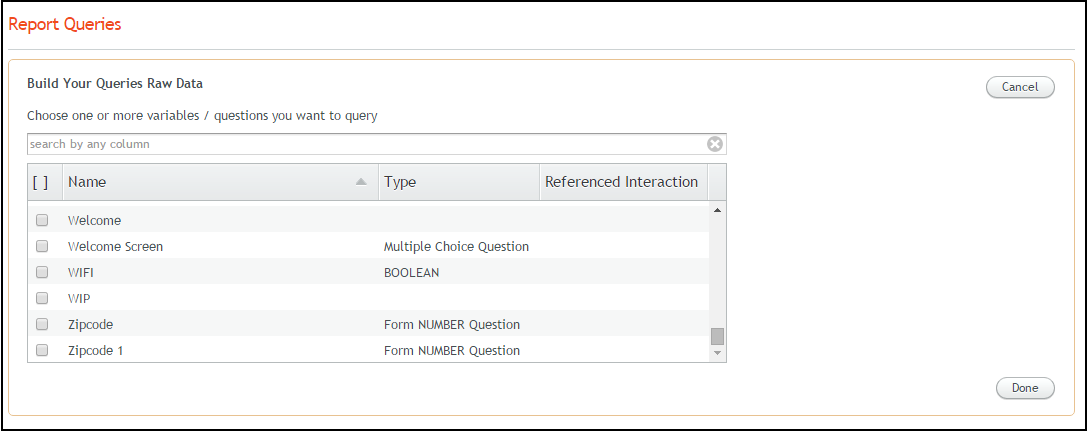
In the search field, enter the name of the required variable or question. As you type, variables or questions whose names contain the entered letters are displayed, allowing you to select the desired variable.
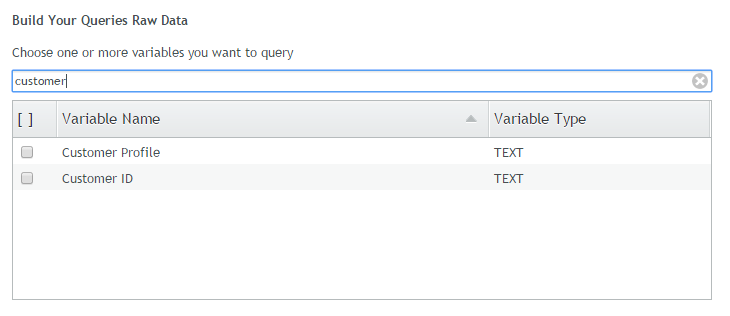
Alternatively, you may select the required variable(s) or question(s) from the full list, by selecting the checkbox(es) from the relevant row(s).
Note
If a selected question is part of a loop, the Raw Data report will only contain the answer to the last iteration of the question. In order to obtain answers for all iterations, store the answers in a Collection variable using an Allocator and then build a query for the collection variable (or add the collection variable to an existing query).
When you are finished adding variables and/or questions to the query, on the right side of the Build Your Queries frame, click Done.
The query is saved, and its variables and/or questions are displayed in the Report Queries area.
To add another query, click the Add Query link, and repeat Steps 2 and 3 above.
Working with Raw Data Reports
You can view and manage Raw Reports that have been run using the Report Status page.
The Report Status page is accessed from the Reports page, by clicking Status in the row of the relevant report.
 |
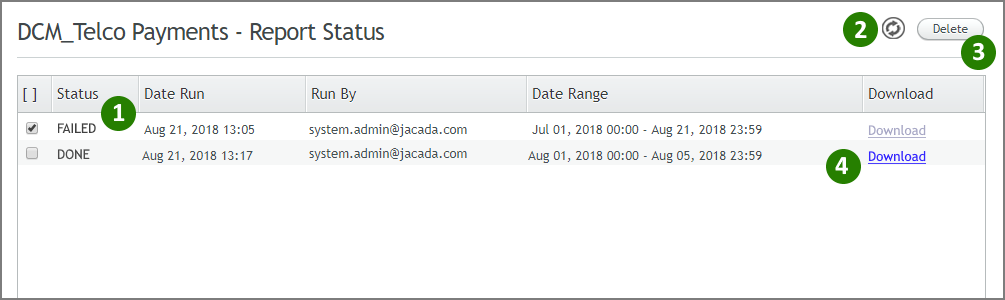
Features of the Report Status page are described below:
 |
Item | Feature | Description |
|---|---|---|
1 | Status | Provides information about each report instance that has been run. By default, reports are sorted according to the Date Run column with the most recent instance listed first. You can also sort reports by Status or Run By, in ascending or descending alphabetical order. Possible report statuses are:
|
2 | Refresh | Updates the Status grid with the latest information from the X‑Platform Server. |
3 | Delete | Removes selected report instances from the Status grid, deleting them from the account. |
4 | Download Link | Exports completed report data from the selected report to one or more CSV files, compressed to a single ZIP file. When the report includes more than one query, the result of each query will be stored in a separate CSV file. Clicking Download will save the ZIP file to your browser's Downloads folder. The filename is the name of the report with a date stamp appended. For example: NoteThe Download link will be enabled only for reports with a status of Done. |
Updating Raw Data Report Parameters
Clicking the link in the Name column of the Reports page opens the Report Details page. This page allows you to view and update the metadata and queries of the selected report.
 |
Updating Report Metadata
Updating metadata involves changing the name and/or description of the report. The selected Flow (and, if relevant, the Show Sub-Flow Elements value) may not be changed.
At the right side of the Report Details page, click Edit. The Name and Description fields become editable.
Update the report name and/or description, as required.
Click Save. Changes are saved, and the page is updated with the new values.
Modifying Report Queries
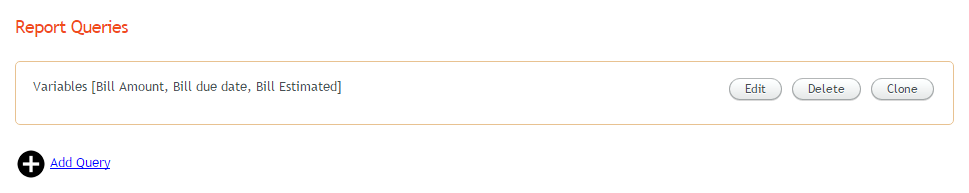
The buttons on the right side of the Report Queries frame enable you to update an existing query.
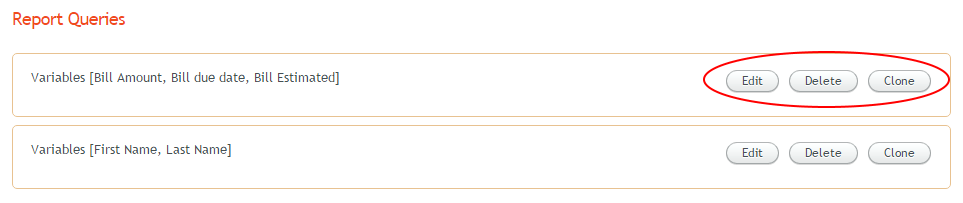 |
The following options are available:
Edit: Clicking Edit opens the Build Your Queries frame, which allows you to update the parameters of the query. For details about working with the Build Your Queries frame, click here.
Delete: Clicking Delete removes the query from the Report Queries frame.
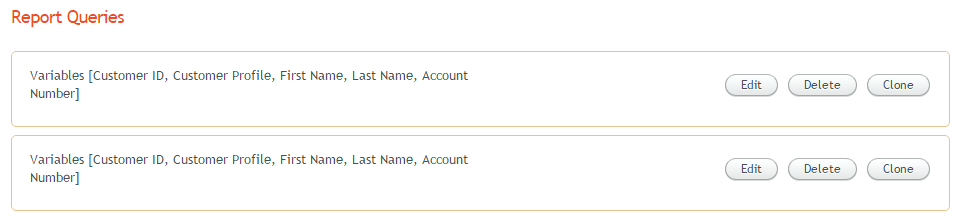
Clone: Clicking Clone copies the query. You can then click Edit to make modifications to the cloned query.
The Clone capability enables you to quickly add another query that is similar to a query that already exists.
 |