Understanding the RPA Monitor Calls View
Uniphore's RPA Monitor provides three different viewing modes to assist you in analyzing and understanding RPA activities: Calls, Sequences and the default Bots view.
Viewing Calls in the RPA Monitor
Tip
For basic information about the RPA Monitor page, see the RPA Monitoring: Overview.
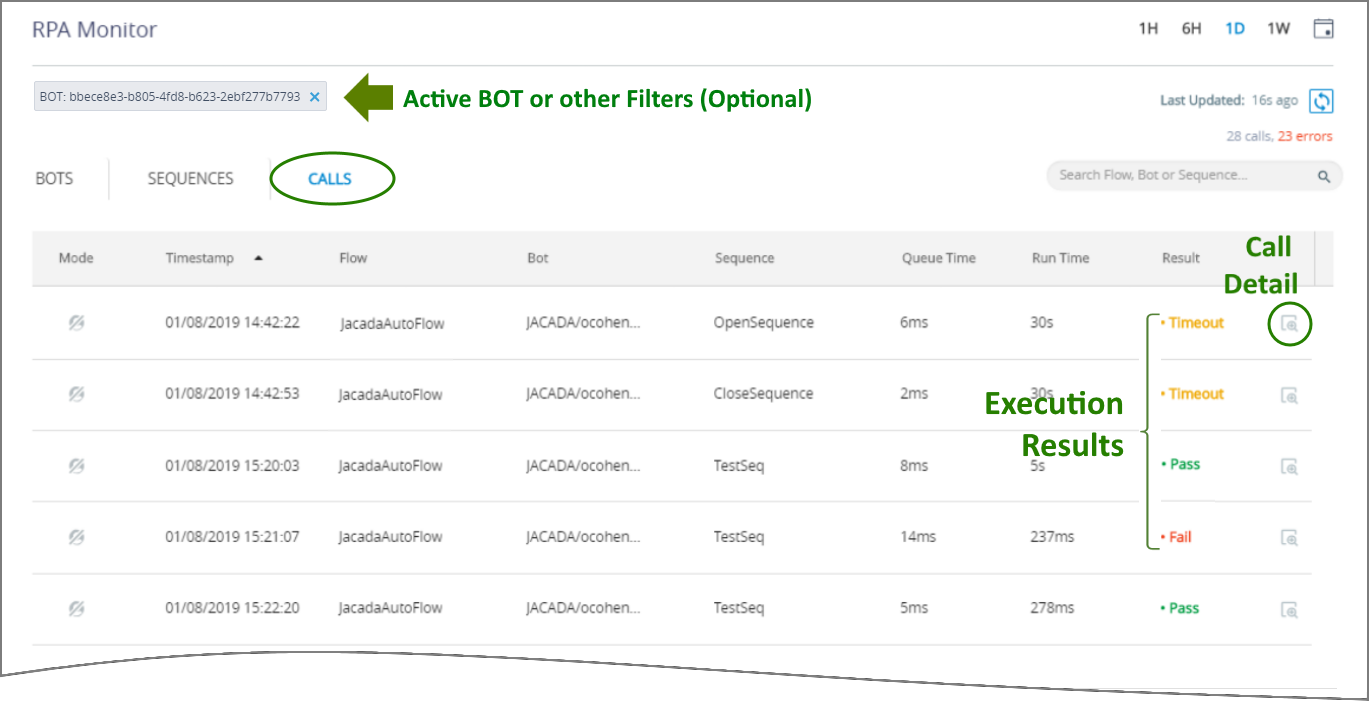 |
The Calls view displays historical activity grouped by RPA Call, as shown above.
Each Call in the view is presented alongside its key information in a grid. You can click on different columns to change the sort order of the information displayed:
Item | Description | ||
|---|---|---|---|
Mode | The Automation Mode (Attended or Unattended) used to invoke the Call. | ||
Timestamp | The server time of the Call. | ||
Flow | The name of the Flow that invoked the RPA Call. | ||
Bot | The name of the Bot executing the Call. | ||
Sequence | The name of the Sequence that invoked the Call. | ||
Queue Time | The length of time that the Call waited for a requested Bot to become available for use. | ||
Run Time | The execution time that the Call required from a Bot. | ||
Result | The Call outcome reported by X‑Platform. A Call Result can be:
| ||
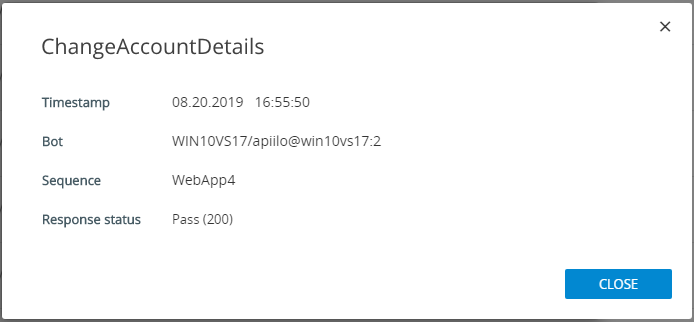
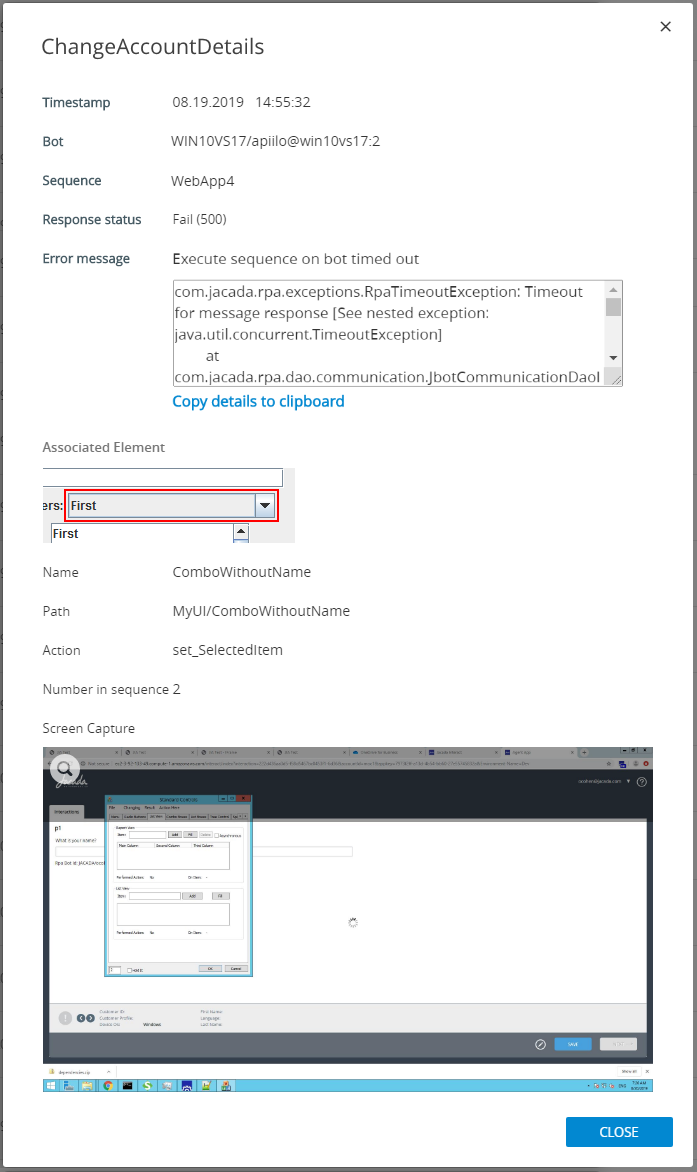
Call Execution Detail | Click on the Magnifier
|

Applying Quick Filters to the Calls View
When needed (for example, when the Calls list is long) you can create a Quick Filter that shows the activities associated with only a single Call:
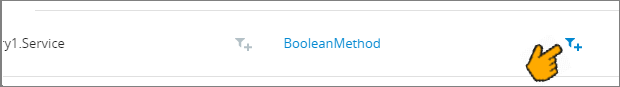
Clicking on an element name (or on the Filter  icon that appears when you hover over an element) adds it to a Quick Filter at the top of the Monitor page and removes all non-matching Calls from the view.
With the filter applied, you can switch between views in the RPA Monitor to see information about all the RPA elements that are related to the selected Call.
Note
Applying a Quick Filter will update data in all views of the RPA Monitor.
To release an active filter, click on the X at its right side. Adding or releasing a filter does not affect the column sort orders or history selections you have previously made.