RPA Monitoring: Overview
You can track, filter and display all of your X‑Platform Robotic Process Automation (RPA) activities using the RPA Monitor in the X-Console.
RPA monitoring tracks real-time RPA activities for your account as well as up to 60 days of RPA activity history. It enables you to easily analyze all RPA Resources, including:
Bots. Live status of Bots used by RPA, along with the ability to search, filter and view the Bot activity history with key details.
Sequences. Search, filter and view RPA Sequences, including activity durations and errors encountered.
Calls. Search, filter and view Calls executed by Flow, Bot or Sequence; view Call execution time, duration and detailed status results.
Note
Before you can begin using the RPA Monitor, RPA Resources need to be enabled for your account.
The RPA Monitor page enables you to perform both high-level and detailed analysis of RPA activities for your account. Views can display results for a specified date and time range and also be filtered according to one or more specified elements.
About the RPA Monitor Page
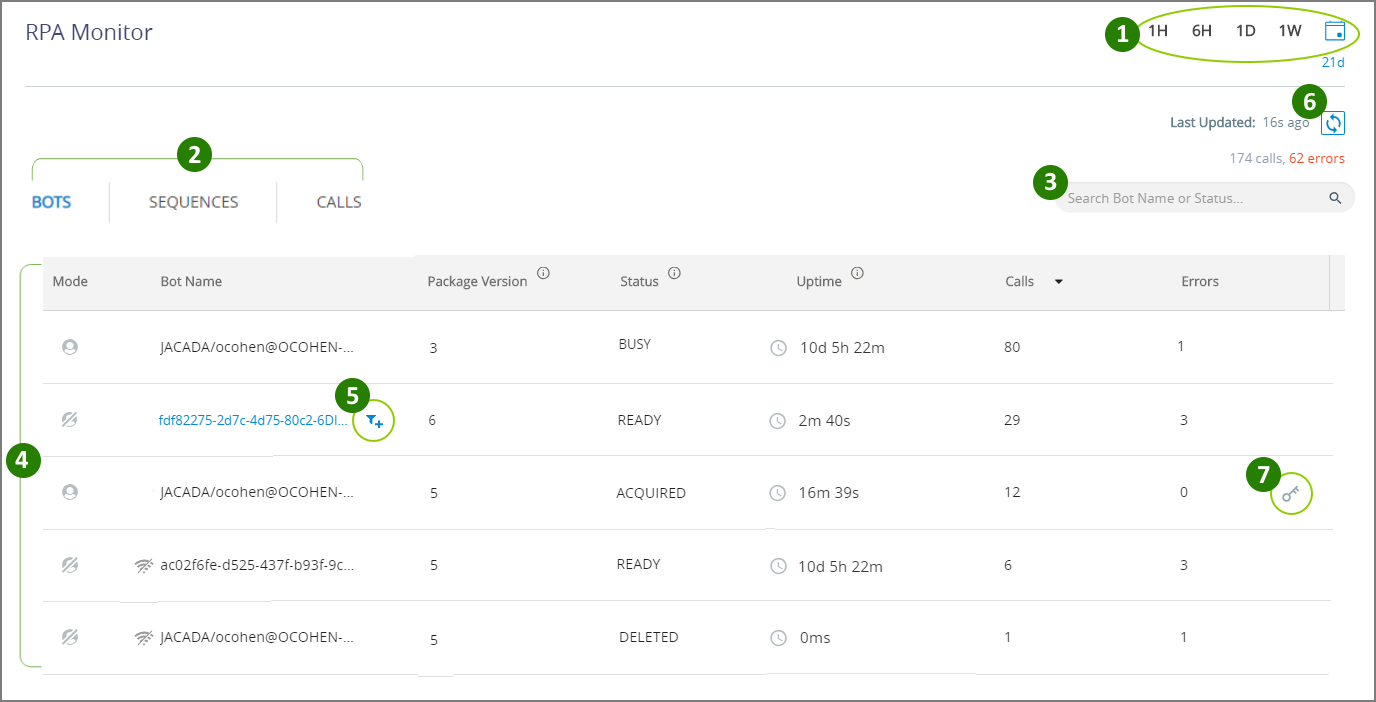
The RPA Monitor page shows both a real-time Bots view as well as a selectable history of activities:
 |
Item | Feature | Description | |
|---|---|---|---|
1 | Time Range Selector | Select the time interval for the history shown on the Monitor page. You can select up to 60 days of RPA Monitor history for analysis. For details on using the Date/Time Selector click here. NoteThe total number of filtered elements is shown just above the Search Box, along with the number of filtered elements that have error results. | |
2 | View Selector | Select the current view for the Monitor page. By default, the Monitor opens in the Bots view. You can also choose to view Sequences or Calls. See more details about each view in its related article. Note | |
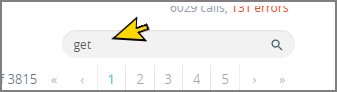
3 | Search Box | Enter a few letters in the Search field to display only those elements that match:
The search is performed on text fields for all elements in the current view . | |
4 | Element List | The list of RPA elements in the selected view. By default, each page displays up to 50 elements. When the list is longer, you can select from multiple Monitor pages to view additional elements:
| |
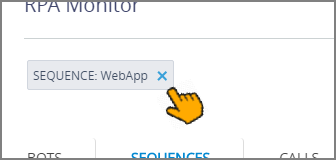
5 | Quick Filter | Click on an RPA element name (or on the Filter Each selected filter is displayed at the top of the Monitor page and will persist for all Monitor views until you remove it by clicking on the X:
You can use multiple filters to locate and display only those elements which are useful for your current analysis. NoteThe total number of filtered elements is shown along with the number of filtered elements that have error results, just above the Search Box. | |
6 | Refresh Data | Clicking on the Refresh The time since the last update was performed is also shown. | |
7 | Bot Release | Clicking on the Bot Release You may want to release a Bot if it appears to be stalled. X‑Platform also provides a built-in timeout mechanism for RPA Bots, This default timeout setting can be changed via the Timeout Settings tab of the application using the Bot. |