Working with the Analysis Panels
After you create a X-Designer Flow with all of its visual and navigation logic steps, you typically want to ensure that it will run as you and your users expect. X‑Platform provides a set of tools that make this process simpler and more intuitive.
You access these tools using the Analysis Toolbar that appears at the right side of the Flow Map:
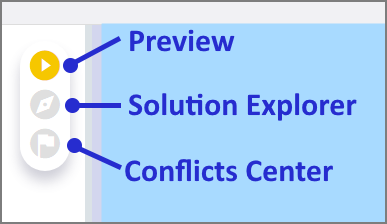 |
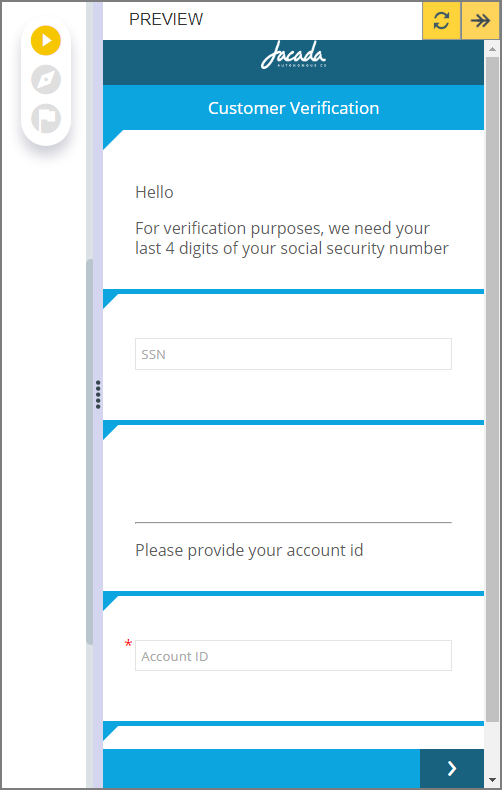
Preview. Shows a simulation of the Flow for testing and review purposes. The simulation uses the Channel type (i.e., Agent, Web Self Service, Mobile Web, etc.) that is assigned in the Run menu of the main toolbar. For more details, see: |
| |
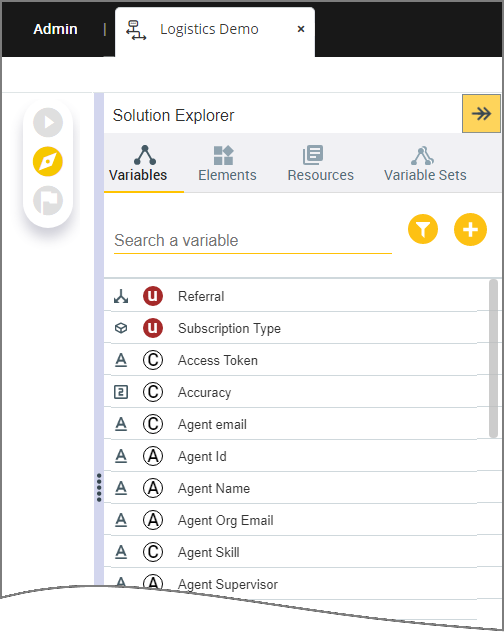
Solution Explorer. Lists all User, System and Environment variables available to the current Flow, enabling you to view their details and the specific elements which are using them. For more details, see Using the Solution Explorer. |
| |
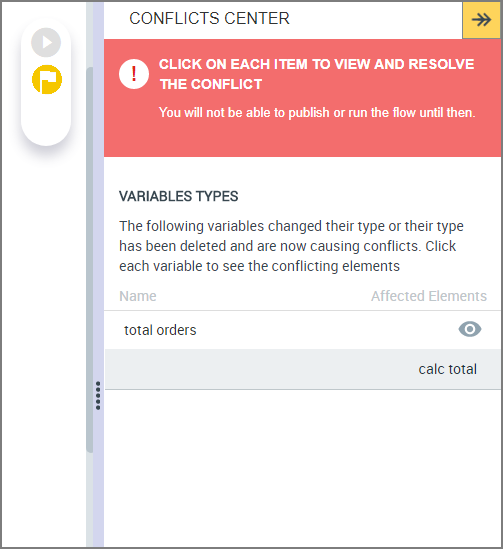
Conflicts Center. Displays any conflicts and defects in your Flow and highlights the affected elements in the Flow Map, so that can easily fix them. For more details, see Conflicts Center: Resolving Variable Conflicts. |
|
Closing the Analysis Panels
From the open panel, click the double arrow icon  at the top right. The current Analysis Panel closes.