View Agent Details
This feature allows to view Agent-related details and Call Metadata details.
By default, system will display the Organization to which the QA belongs in top right corner of the page.
Select Category from the drop-down list.
Select QA monitored score from the drop-down list. QA-monitored scores are fetched from U-Analyze which the Business Analyst has selected scores as QA-monitored scores.
If QA-monitored scores are not available, then system will display a message on the Dashboard screen “Selected Category does not have any Scores to be monitored by Quality Analyst.”
Select an Agent Name (Display Name) or Agent ID whose reports QA wants to analyze from the drop-down list.
Select the Period (Week, 2 Weeks, Month, Custom Range) from the Calendar. Administrator has an option to configure the custom date range in between 90 days to 365 days. Based on the configured value, Quality Analyst can select the custom date range.
Select the From date and To date in which the reports to be displayed in the respective fields. By default, system will display the reports for last active 2 weeks.
Note
System will allow QA to select maximum of 1year date range and allow user to select for previous 2 years.
Click Search button to view the Agent Reports for the selected search criteria.
Click Filter button to select any of the options including Business Rule, Score (Only Active QA Monitored Scores), Call Attributes or Metadata. This filter is not mandatory.
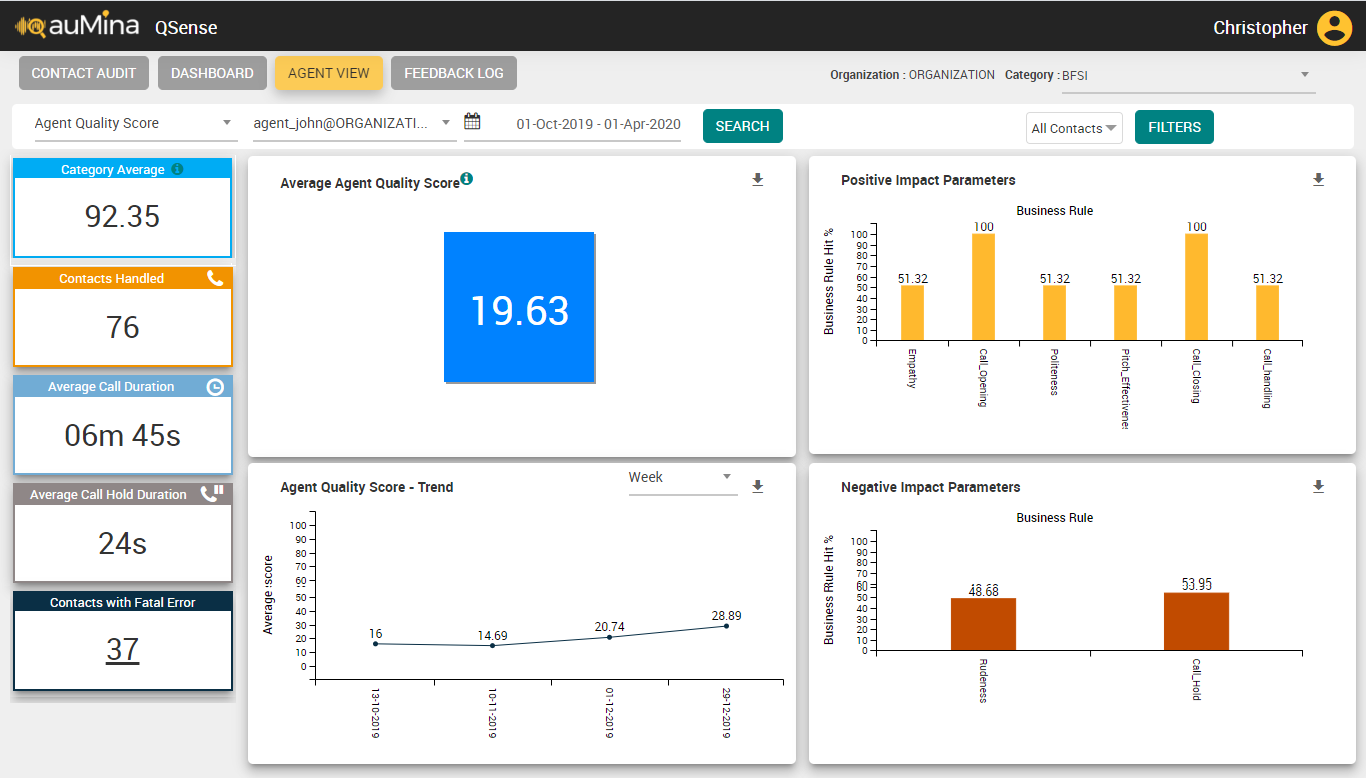
In the left side of page, specific Agent-related and Call Metadata details are displayed. QA can drill down to Fatal error calls.
Category Average - It is the average score of all the contacts processed for the selected category and date range. This provides a comparison of the individual average score of agents with the selected category average.
Contacts Handled – Contacts handled by the selected Agent for the specified date range
Average Call Duration (hh:mm:ss) – Average Call Duration for the calls handled by the Agent for the specified date range
Average Call Hold Duration (hh:mm:ss) – Average Call Hold Duration for the calls handled by the Agent for the specified date range
Contacts with Fatal Error – Number of calls for which Fatal Error is detected post evaluation for the selected Agent. The number of calls is hyperlinked to Contact Analysis which will show the list of contacts with Fatal error.
On the right side of page, selected Agent-related details are shown. For example, if Quality Score is selected the following details are displayed:
Average Agent Quality Score – The average of the selected agent quality score for the calls handled by the selected Agent for the specified date range under the chosen category. A trend arrow is displayed (Upward or Downward) which is the trend of the selected agent quality score for the calls handled by the selected Agent for the specified date range in comparison with the prior same date range window. If the current selected date range score is greater than the previous score, then an upward trend arrow along with the difference is shown. A downward trend arrow is shown in case of vice versa.
Agent Quality Score – Trend – The trend of the selected Agent Quality Score for the selected Agent, and duration(Day, Week or Month).
Positive Impact Parameters – Shows a bar graph of the positive impact parameters such as politeness, empathy, pitch effectiveness etc. for the selected score.
Negative Impact Parameters – Shows a bar graph of the negative impact parameters such as rudeness, call hold etc. for the selected score.
Note
For Positive Impact Parameters and Negative Impact Parameters if the BR count is more than 10, a green toggle button is displayed. By default, only 10 BRs are displayed. If the toggle button is clicked, all the BRs are displayed. If the BR count is less than 10, the toggle button will not be displayed, and all the BRs (less than 10) are displayed.
Click Download (
 ) icon to download the chart in .png format.
Click on the specified charts to drill down to the Contact Analysis screen with the list of contacts based on the filters applied.