Quality Analyst Dashboard
This feature allows Quality Analyst to view Agent and Call Metadata details.
 |
By default, system will display the Organization to which the QA belongs in top right corner of the page.
Select Category from the drop-down list.
Select QA monitored score from the drop-down list. QA-monitored scores are fetched from U-Analyze which the Business Analyst has selected scores as QA-monitored scores.
If QA-monitored scores are not available, then system will display a message on the Dashboard screen “Selected Category does not have any Scores to be monitored by Quality Analyst.”
Select the Period (Week, 2 Weeks, Month, Custom Range) from the Calendar. Administrator has an option to configure the custom date range in between 90 days to 365 days. Based on the configured value, Quality Analyst can select the custom date range.
Select the From date and To date in which the reports to be displayed in the respective fields. By default, system will display the reports for last active 2 weeks.
Note
System will allow QA to select maximum of 1year date range and allow user to select for previous 2 years.
Click Search button to view the Dashboard for the selected search criteria. System will display deleted / unmapped Agents in charts, each chart has to be valid for the selected time range.
Select Contact Type - Voice, Chat or Email from the drop-down list to view the Agent and Call Metadata details for the specific contact.
Click Filter button to select any of the options including Business Rule, Score (Only Active QA Monitored Scores), Call Attributes or Metadata. This filter is not mandatory.
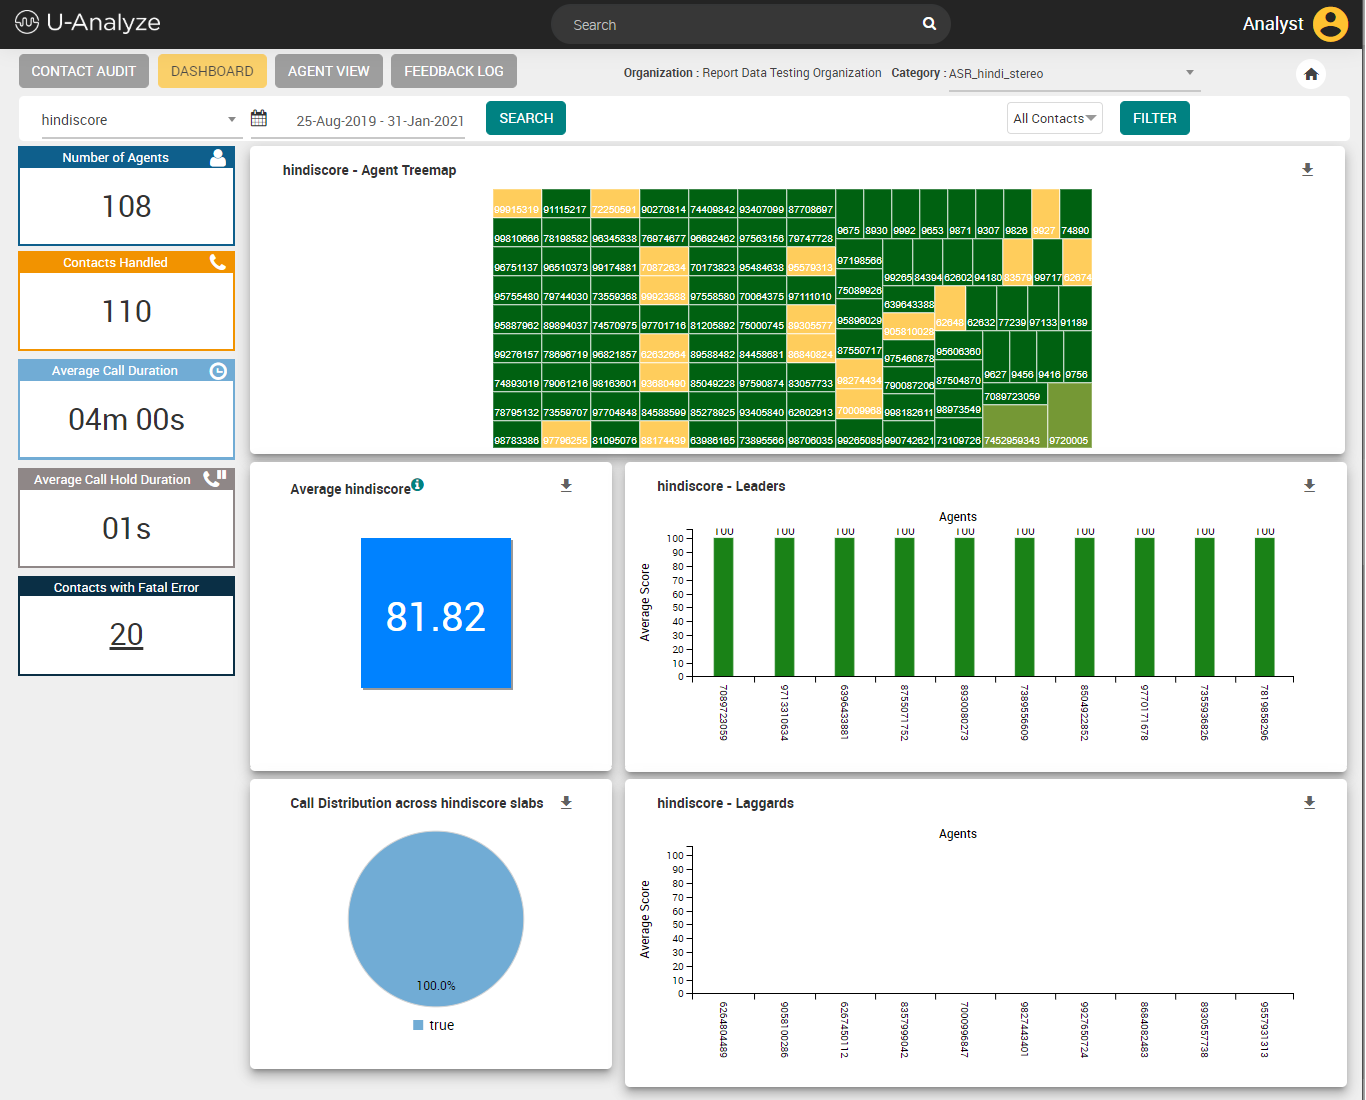
In the left side of page, Agent and Call Metadata details are displayed. QA can drill down to Fatal error calls.
Number of Agents – Agents mapped under the QA (Only those Agents will be considered for which the calls have been processed for the applied filter)
Contacts Handled – Number of contacts processed for the applied filter
Average Call Duration (hh:mm:ss) – Average Call Duration for the calls processed for the applied filter
Average Call Hold Duration (hh:mm:ss) – Average Call Hold Duration for the calls processed for the applied filter
Contacts with Fatal Error – Number of contacts for which Fatal Error is detected post evaluation for the applied filter. The number of contacts is hyperlinked to Contact Analysis which will show the list of contacts with Fatal error.
Click Download (
 ) icon to download the chart in .png format.
The Agent tree map shows the comprehensive view of all the agent ‘s performance mapped under the specific Quality Analyst and displays the agent’s display name/ID in each block. The size of the block represents the number of the contacts attended by them and color of the block represents the average score range.
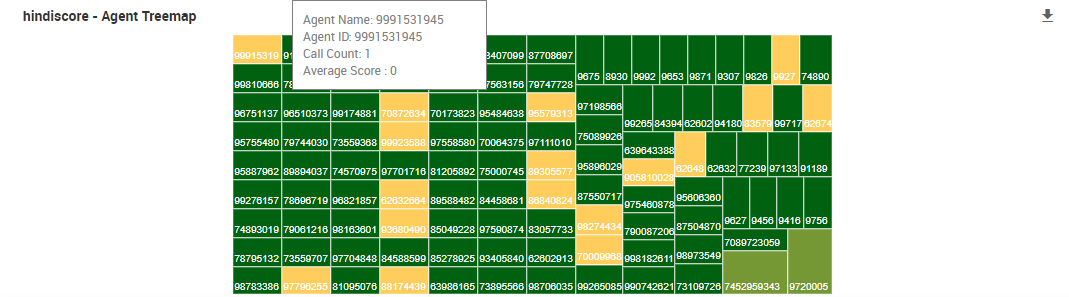
When you mouse hover the block, system displays the agent’s display name, agent’s CRM ID, average score, and number of contacts handled by each agent.
The Average Score chart shows the average score of the selected QA monitored score for calls processed in the selected date range of the selected category for the Agents mapped under the logged in QA. This score is compared against the average score of same prior date duration range and is shown as upward or downward trend arrow. For example, if there are 10 agents mapped under a quality analyst QA1 and each attended 10 calls under a category A per day and the selected date range is 5 days. Then, the average score is the average of the scores for the calls processed in the selected date range of 5 days under category A for all the 10 agents mapped under the quality analyst QA1.
The Leaders chart shows the top 10 Agents and their average score.
The Laggards chart shows the bottom 10 Agents and their average score.
Click on any Score Slab to drill down to Contact Analysis screen with the list of contacts based on the filters applied.
The name of the Leaders and Laggards charts are configurable. In System Manager --> System Properties --> QsenseChart Properties, the user can provide a name for the chart. The name given in the KeyValue will be the name for Leaders Agent Chart and Laggerds Agent Chart.
Click on Agent – Leader or Laggard to drill down to contacts of the Agent.