Monitoring Integration Point Behavior
Because an Integration Point (IP) is a key component used in many Flows. X‑Platform maintains IP Logs, an ongoing record of activity for all IPs that have been run.
Logs include data such as whether the IP performed as expected, how long the request took, and other details that can help you monitor Flow execution and locate issues that might prevent a Flow from running smoothly.
Note
The IP Logs list is available to users with Roles of Flow Admin and higher. For more details about Roles, click here.
Accessing the IP Logs
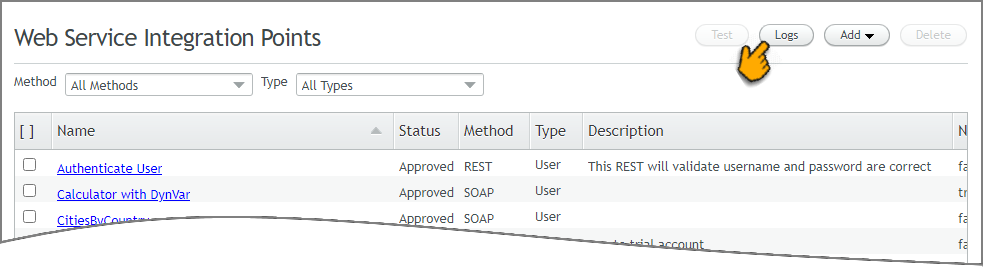
You access the IP Logs list by clicking Logs at the top right of the Web Service Integration Points page:
 |
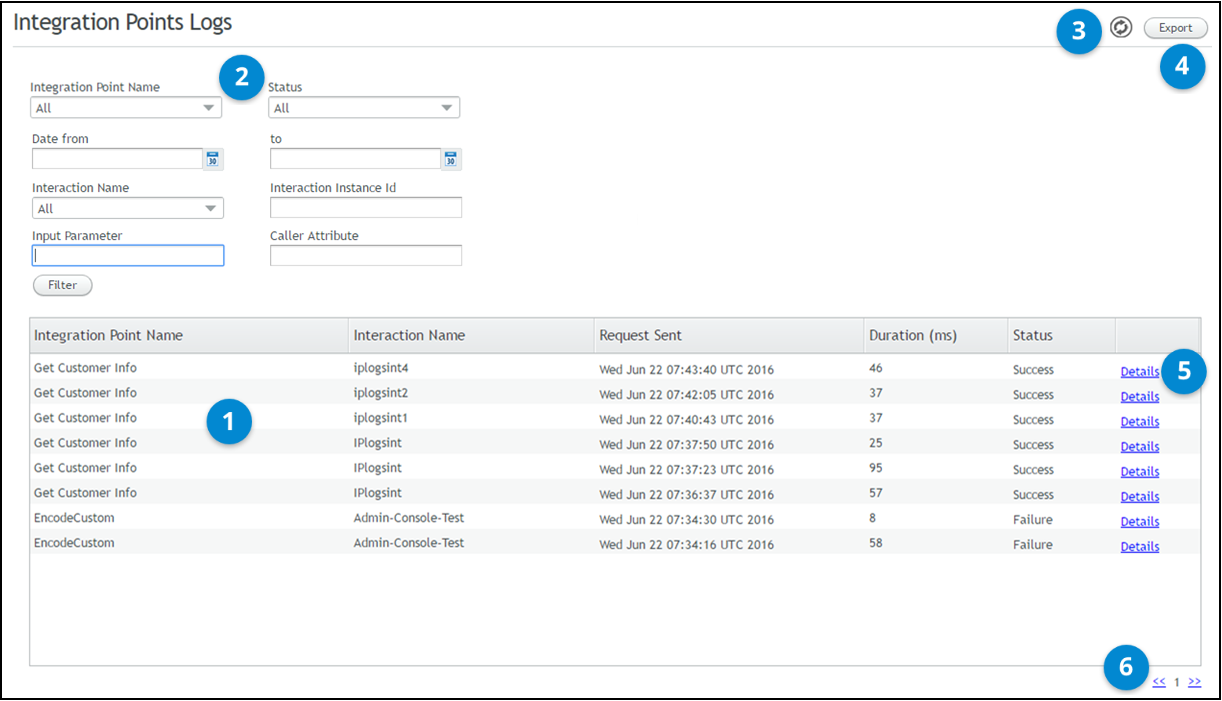
The IP Logs page is displayed, listing all Integration Points that have been run in the account. By default, the list is ordered by the most recently run IPs first.
 |
Number | Feature | Description/Notes |
|---|---|---|
1 | IP Logs List | Displays basic information about each IP that was run. The list cannot be sorted manually (according to column header), but can be filtered using the filtering options provided above the list. |
2 | Filtering Options | You can filter the list according to selected search parameters. For details, refer to Filtering the IP Logs List. |
3 | Refresh | Updates the IP Logs list with the latest data from the X‑Platform Server. |
4 | Export | Saves the logs record to a CSV file. For more information, refer to Exporting the IP Logs List. |
5 | Details Link | Displays a pop-up with detailed data about the selected IP instance. For more information, refer to Viewing IP Log Details. |
6 | Page Navigator | Allows you to move quickly to other pages in the IP Logs list. |
Filtering the IP Logs List
You can use filtering options to show a subset of IP Logs based on various search parameters, making it easier to locate relevant IP execution instances. You can filter on multiple filters parameters.
After specifying your filters, click Filter button to activate filtering.
 |
Integration Point Name. Lists all Integration Points defined for your account (regardless of whether they have run). Select the relevant IP from the list, or enter the name of the required IP. Autocomplete functionality is supported.
Status. Select from All, Success or Failure.
Keep in mind that when the web service has returned a success code (e.g., 200 OK, 201 Created, etc.), the status in the log is Success, regardless of whether response mapping succeeded.
Date. Click the Calendar icons to open the date picker, and select start and end dates for the search. At the bottom of the date picker, you can also specify execution Start and End times by hour and minute.
Interaction Name. Lists all Interactions defined for your account. Select the relevant Interaction from the dropdown list, or enter the name of the required Interaction. Autocomplete functionality is supported.
Interaction Instance ID. If you know the unique identifier of the required Interaction instance, enter it in the textbox.
Input Parameter. A free text field in which you can enter any of the input values defined for the Integration Point (if relevant). Only one input parameter may be specified.
Caller Attribute. A free text field in which you can enter any single caller attribute associated with an Interaction instance. Supported caller attributes are:
DTMF. The DTMF code that is passed with the customer's call (supported when Direct Dial with DTMF Code is selected as the Call Now handling method).
DNID. An identifier for the number, generally the last 4 or 6 digits of the phone number (relevant when the DNIS Manager is used for call handling).
Call Return Number. The number entered by the customer as part of a request for a callback. This number is allocated automatically as the Call Return Number Entered Read Only variable.
Caller ID. Supported when the DNIS Service Application is used for call handling. The value of the attribute is usually the phone number to which the user dialed. During the DNIS Manager or DNIS As a Service flow, it is allocated automatically as the Click to Call Caller ID Read Only variable.
History Search ID. This attribute can be used when the call center has passed a unique identifier in the historySearchId parameter for the Interaction instance URL, and/or when the historySearchId Session Variable has been allocated a value in the Interaction. (If the variable is allocated more than once, the latest value is used.)
Viewing IP Log Details
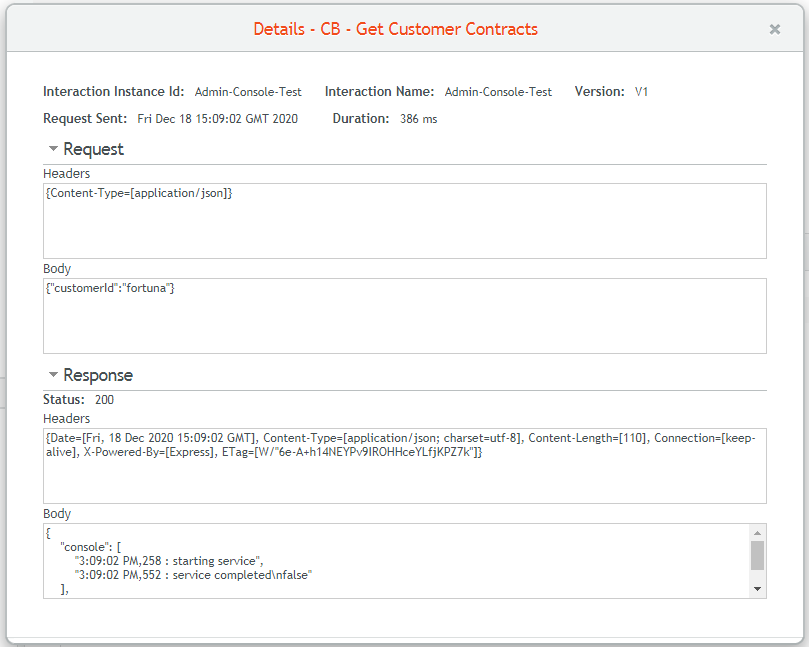
Clicking Details on the right side of the IP Logs list will display a popup with key runtime data from the selected IP instance, including the Request (with Headers) and the runtime Response.
The Response format for REST IPs is JSON. The Response format for SOAP IPs is XML.
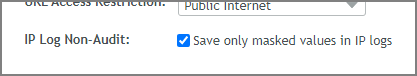 |
If you activated the Save only masked values in IP Logs option for an IP, X‑Platform will mask the specified sensitive data when writing IP Logs for that IP. An example Body with a masked value is shown below. Masking is performed on data that matches Regular Expression patterns that are defined for the account.
If a Custom Integration Point is selected, the popup also displays the IP code version, the defined parameters and their values, as shown below.
 |
Exporting the IP Logs List
The Export feature lets you save the currently displayed IP Logs list as a CSV file. A maximum of 10,000 records can be included in the file. If your IP Logs list contains more records than this, only the most recent 10,000 records will be exported.
Each exported record includes the following information. When no data exists for a field, the related cell will contain the word null.
Integration Point name
Interaction name
Timestamp when request was sent (formatted in mm/dd HH:MM:SS)
Duration of execution (in milliseconds)
Status (either 'Success' or 'Failure')
Request including Headers (formatted in REST or SOAP)
Response (formatted in REST or SOAP)
Click to Call Caller ID
Call Return Number Entered
DNID
DTMF
History Search ID
Interaction Unique ID
At the upper right corner of the Integration Point Logs page, click Export. The Export popup opens.
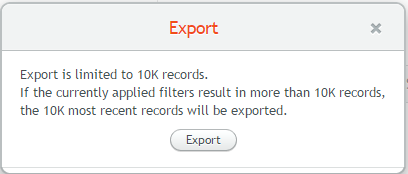
Click Export to confirm. The list will be saved in your local Downloads folder with the name 'ip-logs' followed by the date and time of export, e.g.,
ip-logs-12_18_19 13_09.csv.
Important
If you open the exported CSV file using Microsoft Excel default settings, leading zeroes for fields will not be displayed. This potentially can affect output values like DTMF.