Key Performance Indicators (For On-premise Deployments)
Key Performance Indicators include the Analysis of Scores, Correlation of Scores with Other Scores, Reportable Business Rules, External Metadata, Call Attributes like Call Hold, Call Duration. These reports also include the Business Rule Hierarchy Analysis, its trend, correlation with Business Rules, its correlation with Call Attributes and Metadata. Comparison of Keyword Clouds are a part of KPI Reports.
Key Performance Indicators (For X on Cloud Deployments)
Key Performance Indicators include Keyword Analysis that allows Comparison of Keyword Clouds.
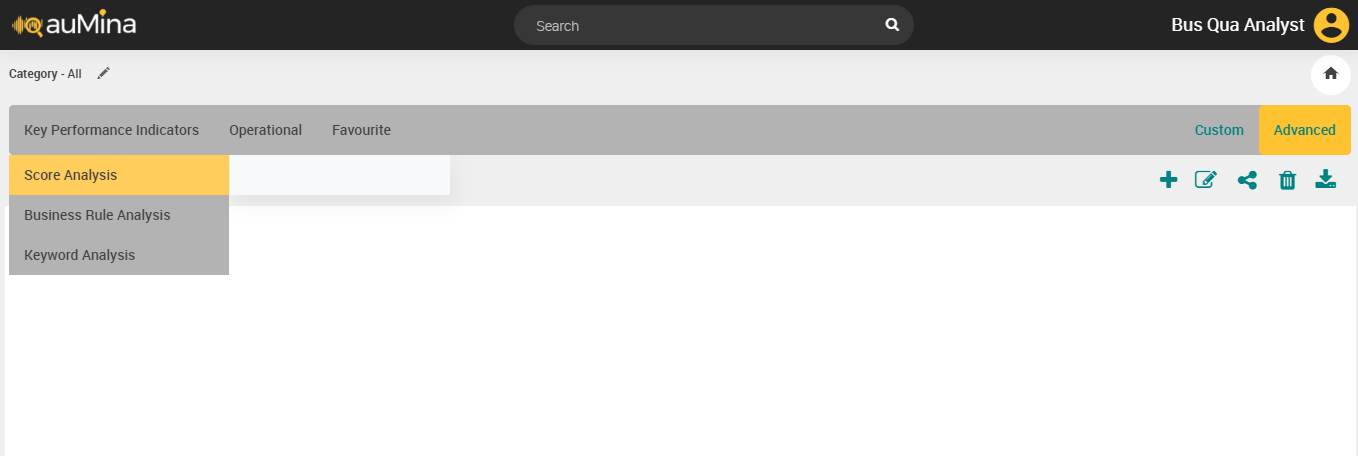
Score Analysis
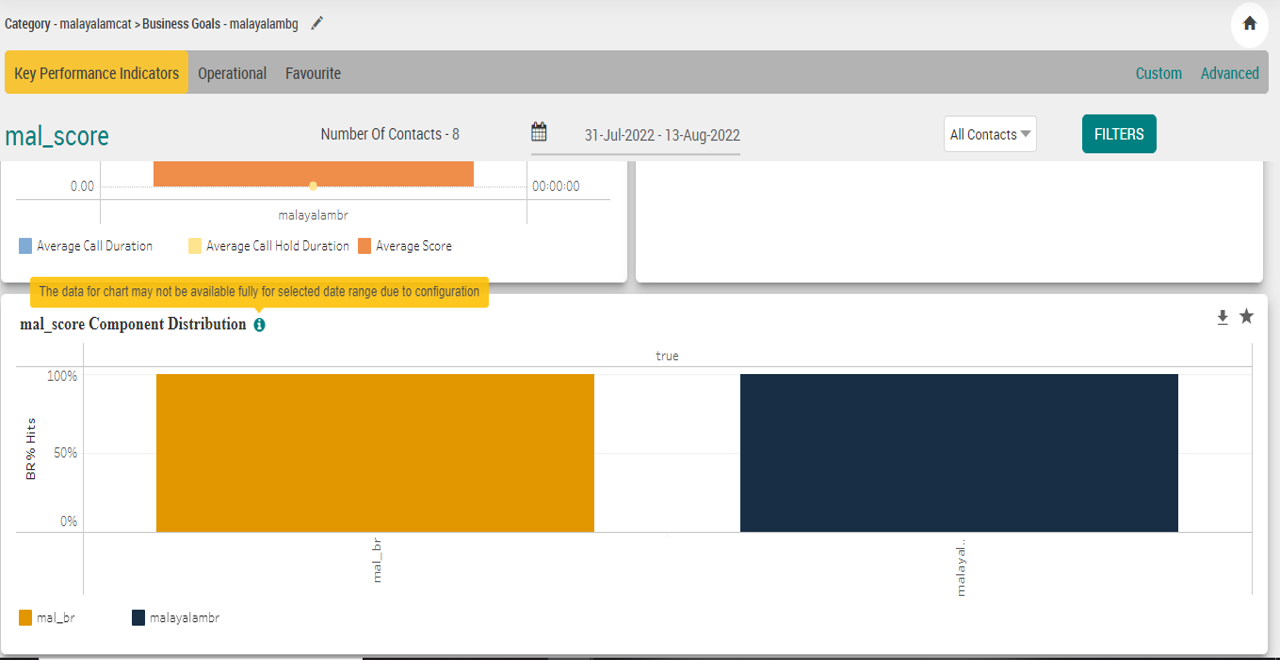
System will display the Score Reports as per the list provided below under Score Analysis – Key Performance Indicators for each of the Score. Score Reports are goal-specific reports. The admin user needs to set the EnableScoreComponentReports to true display the Score Reports. By default, it is set to false. A warning indicator is provided as shown below on top of the chart if this property is enabled intermittently.
Select Key Performance Indicators > Score Analysis. The Category and Business Goal selection pop-up window will be displayed.
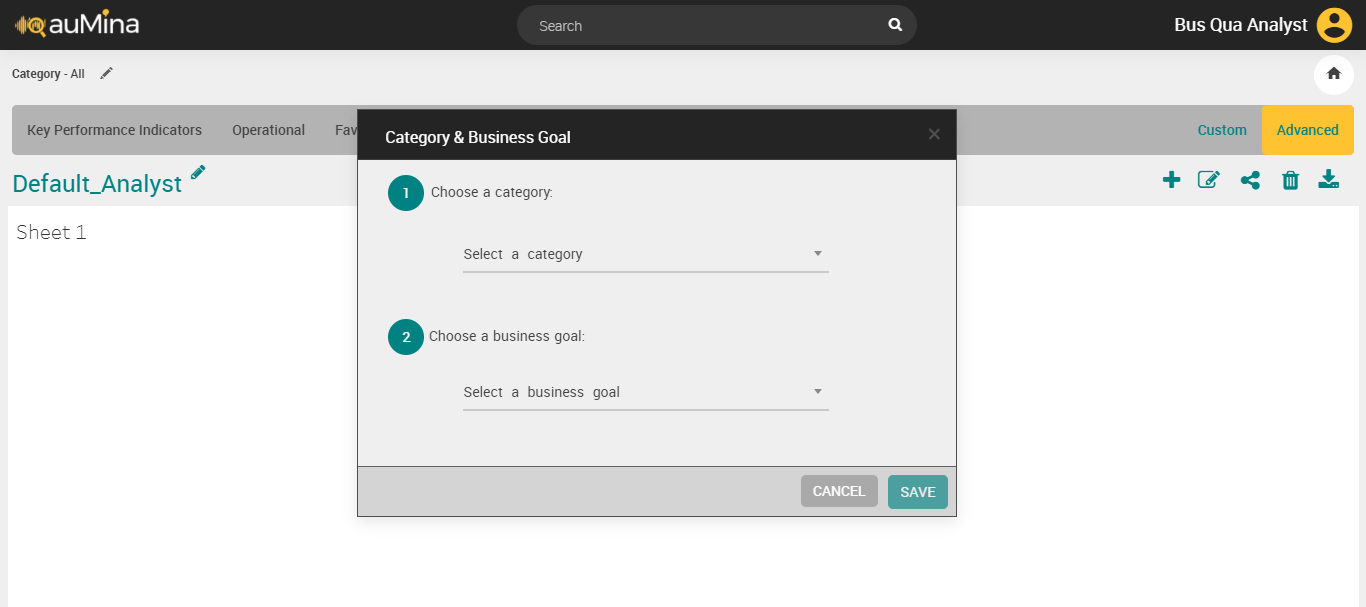
Select a category from the drop-down list.
Select a business goal from the drop-down list.
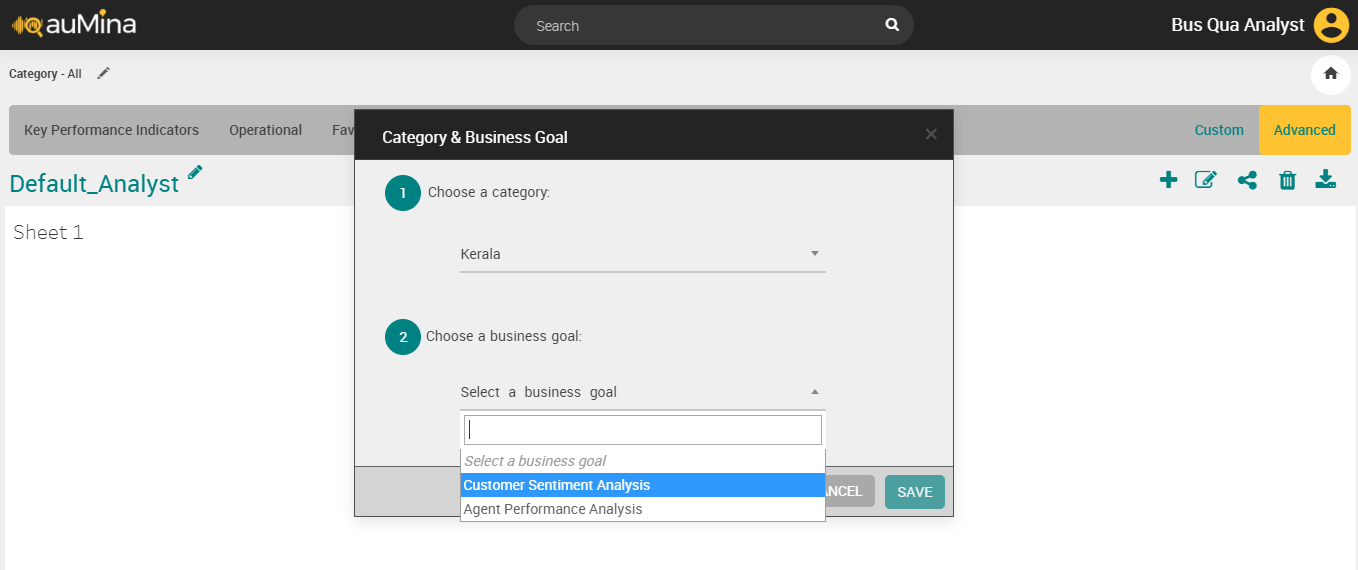
Click Save button. Now, you can see the list of scores for the selected business goal.
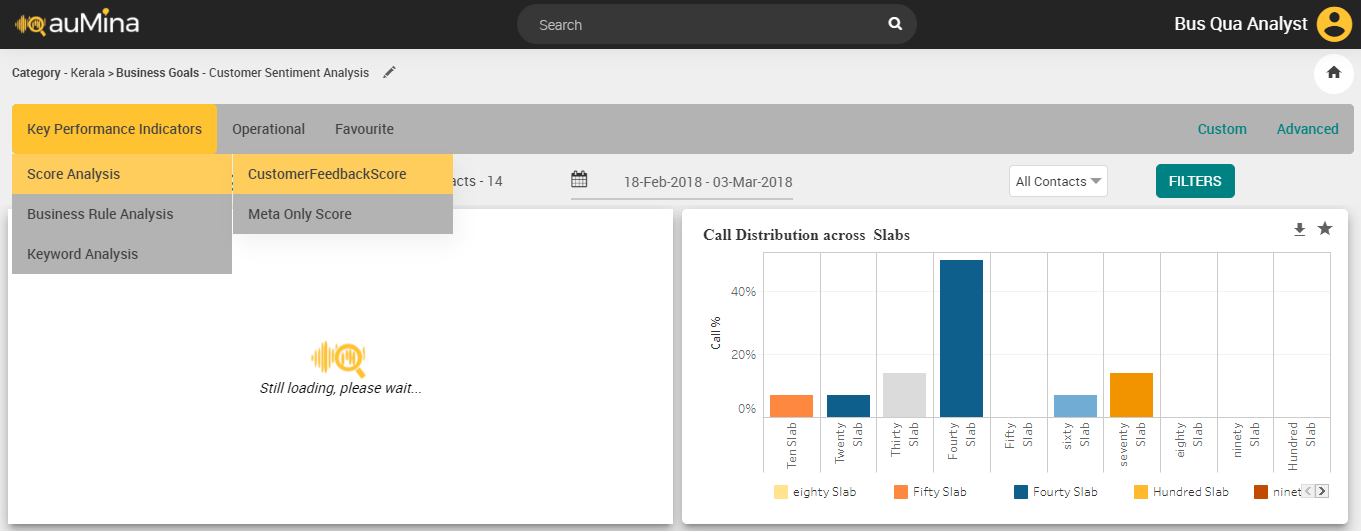
Select the score from the list. The charts for the corresponding score will be displayed.
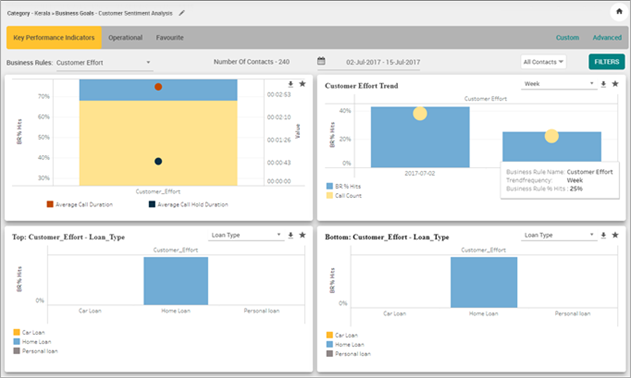
By default, the selected category and business goal are displayed at the top of the page.
By default, the number of contacts for the selected date period for which the reports are displayed is indicated.
Select the Period (Week, Fortnight, Month, Custom Range) from the Calendar. The default time period for the Scores is last calendar fortnight. If no data has been processed for the past fortnight, system displays data for the last active fortnight where the processing was completed.
Select the From date and To date in which the report is to be generated in the respective fields.
Note
System will allow BA to select maximum of 1year date range and allow user to select for previous 2 years.
Select Contact Type – Voice, Chat or Email from the drop-down list. The values selected for Contact Type will be remembered by the system during the session in the Reports module when I am logged in. Selection of single or multiple contact types will be allowed while filtering. By default, the Contact Type will be displayed as All Contacts.
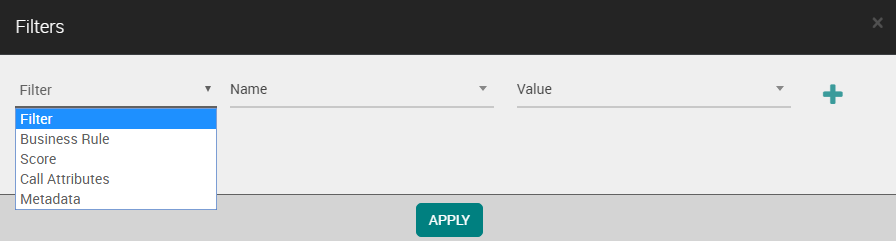
Click Filter button to select any of the options including Business Rule, Score, Call Attributes or Metadata. This filter is not mandatory.
To apply Filter ‘Business Rule’
Select Business Rule from the Filter drop-down list. A list of reportable business rules for the business goal is automatically available in the Name drop-down list.
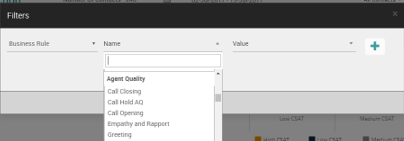
Select the name of the rule from the Name drop-down list.
Select the value True or False.
To apply Filter ‘Score’
Select Score from the Filter drop-down list. A list of scores for the selected business goal is automatically available in the Name drop-down list.
Select the name of the score from the Name drop-down list.
Select the score range from the Value drop-down list.
To apply Filter ‘Call Attributes’
Select Call Attributes from the Filter drop-down list.
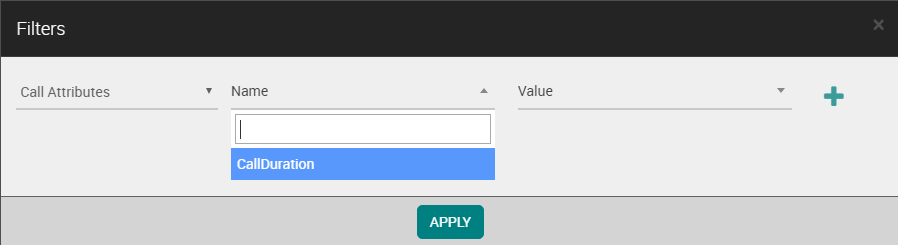
Select Call Duration from the Name drop-down list.
Select the call duration slab which are configured for the category from the Value drop-down list.
To apply Filter ‘Metadata’
Select Metadata from the Filter drop-down list. System will fetch metadata for all the contact types (voice, chat, email). Examples of Metadata: Region, Product details, Customer details, Ticket Number, etc.
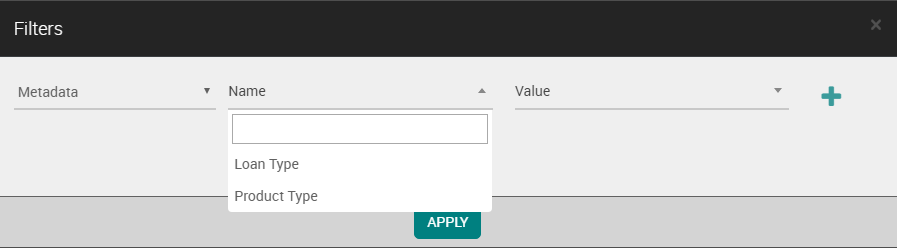
Select name of the metadata from the Name drop-down list.
Select metadata value from the Value drop-down list.
Note
Metadata which contains maximum of 20 unique values is recommended to add as a filter.
Click Apply button to apply the filter for score analysis.
Click Download (
 ) icon to download the chart in .png format.
Click Favourite (
 ) to mark the chart as Favourite.
Chart | Chart Title | Example | |
|---|---|---|---|
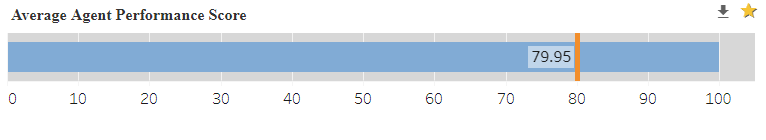
| Average <Score> | Average Agent Performance Score | |
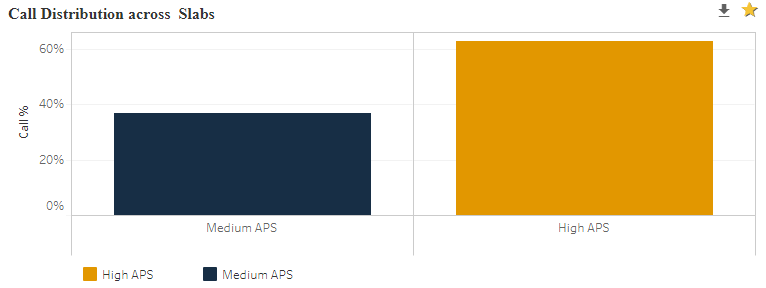
| Call Distribution across <Score> Slabs | Call Distribution across Agent Performance Score Slabs | |
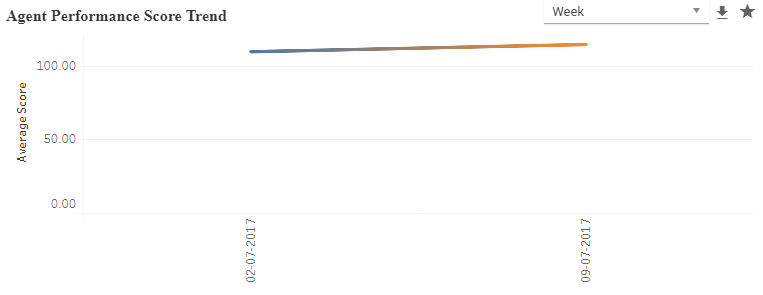
| <Score> Trend | Agent Performance Score Trend | |
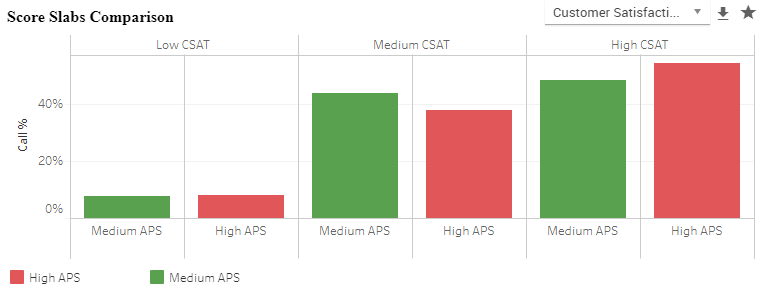
| Score Slabs Comparison | Score Slabs Comparison | |
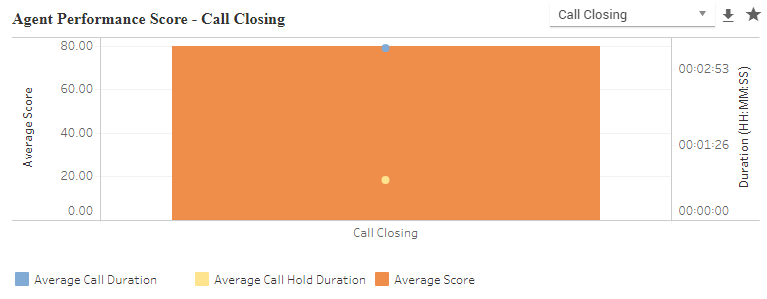
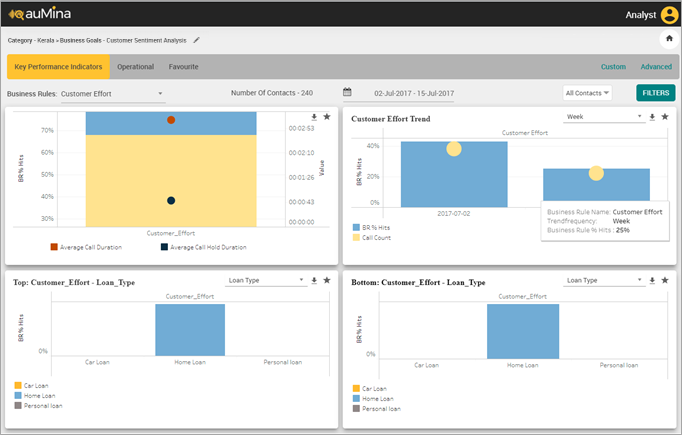
| <Score>-<Business Rule> | Agent Performance Score-Call Closing | |
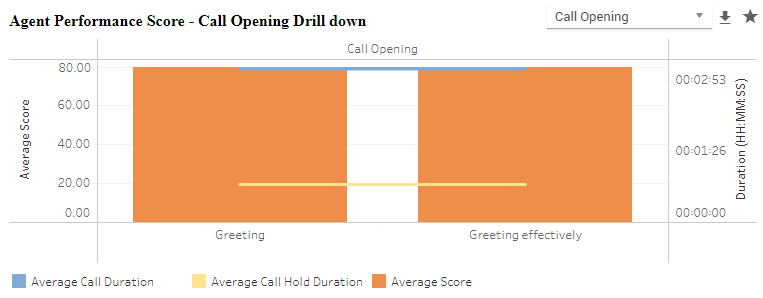
| <Score>-<Business Rule> Drill down | Agent Performance Score-Call Opening Drill down | |
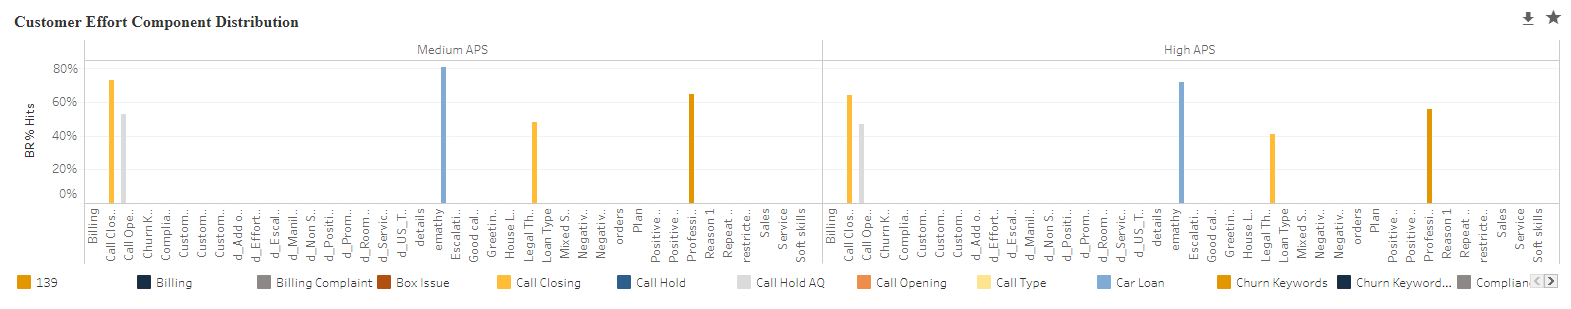
| <Score> Component Distribution | Customer Effort Component Distribution | |
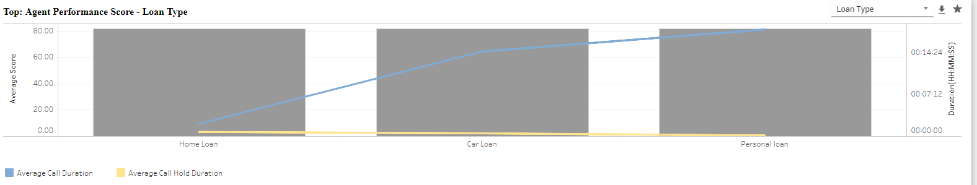
| Top: <Score> - <Metadata> | Top: Agent Performance Score - Loan Type | |
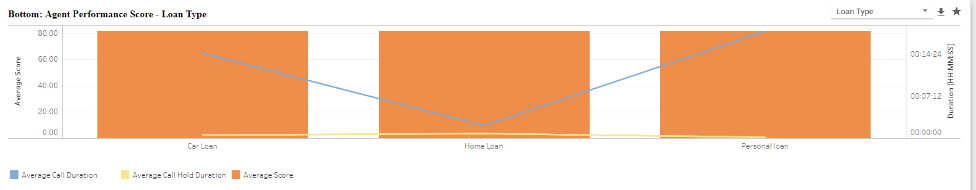
| Bottom: <Score> - <Metadata> | Bottom: Agent Performance Score - Loan Type |
Note
System will allow analyst to drill down to Call Analysis screen from any Score Analysis chart.
Analyst can zoom in and zoom out each chart.
Call Duration and Call Hold Duration will be displayed in HH:MM:SS
In Charts, Slabs such as Call Duration Slabs and Score Slabs will be displayed in the ascending order (not mixed order).
In Charts with Top/Bottom values, if there are more than 10 records which are ranked as Top or Bottom 10, then any Top or Bottom 10 values are displayed. The values are displayed based on count (not based on rank).
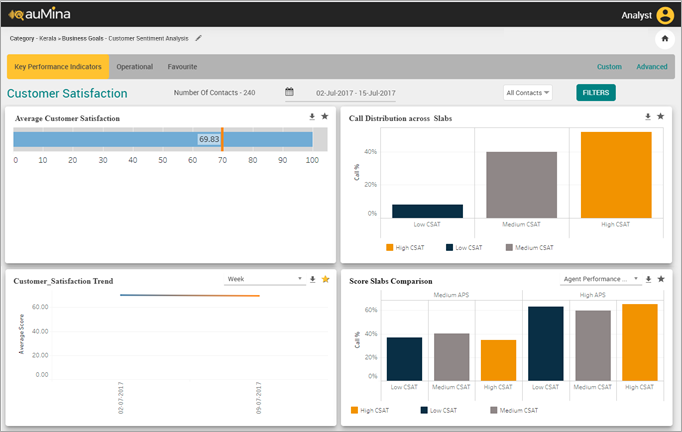
Score Analysis Charts:
Note
Calls having poor audio quality, major silence and abruptly disconnected are not considered in calculating the Agent score as it might affect the accuracy of the score.
Score Analysis
Important
From version 2024.1.1 onwards the Score Reports are available only for users using U-Analyze On-prem/Ansible deployments and is not available for U-Analyze X on cloud deployments.
System displays the Score Reports as per the list provided below under Score Analysis – Key Performance Indicators for each of the Score. Score Reports are goal-specific reports. The admin user needs to set the EnableScoreComponentReports to true display the Score Reports. By default, it is set to false. A warning indicator is provided as shown below on top of the chart if this property is enabled intermittently.
Select Key Performance Indicators > Score Analysis. The Category and Business Goal selection pop-up window is displayed.
Select a category from the drop-down list.
Select a business goal from the drop-down list.
Click Save button. Now, you can see the list of scores for the selected business goal.
Select the score from the list. The charts for the corresponding score are displayed.
By default, the selected category and business goal are displayed at the top of the page.
By default, the number of contacts for the selected date period for which the reports are displayed is indicated.
Select the Period (Week, Fortnight, Month, Custom Range) from the Calendar. The default time period for the Scores is last calendar fortnight. If no data has been processed for the past fortnight, system displays data for the last active fortnight where the processing was completed.
Select the From date and To date in which the report is to be generated in the respective fields.
Note
System allows BA to select maximum of 1year date range and allow user to select for previous 2 years.
Select Contact Type – Voice, Chat or Email from the drop-down list. The values selected for Contact Type are remembered by the system during the session in the Reports module when I am logged in. Selection of single or multiple contact types are allowed while filtering. By default, the Contact Type are displayed as All Contacts.
Click Filter button to select any of the options including Business Rule, Score, Call Attributes or Metadata. This filter is not mandatory.
Click Apply button to apply the filter for score analysis.
Click Download (
) icon to download the chart in .png format.Click Favourite (
) icon to mark the chart as Favorite.
Score Analysis Charts:
Chart | Chart Title | Example | |
|---|---|---|---|
| Average <Score> | Average Agent Performance Score | |
| Call Distribution across <Score> Slabs | Call Distribution across Agent Performance Score Slabs | |
| <Score> Trend | Agent Performance Score Trend | |
| Score Slabs Comparison | Score Slabs Comparison | |
| <Score>-<Business Rule> | Agent Performance Score-Call Closing | |
| <Score>-<Business Rule> Drill down | Agent Performance Score-Call Opening Drill down | |
| <Score> Component Distribution | Customer Effort Component Distribution | |
| Top: <Score> - <Metadata> | Top: Agent Performance Score - Loan Type | |
| Bottom: <Score> - <Metadata> | Bottom: Agent Performance Score - Loan Type |
Note
System allows analyst to drill down to Call Analysis screen from any Score Analysis chart.
Analyst can zoom in and zoom out each chart.
Call Duration and Call Hold Duration are displayed in HH:MM:SS
In Charts, Slabs such as Call Duration Slabs and Score Slabs are displayed in the ascending order (not mixed order).
In Charts with Top/Bottom values, if there are more than 10 records which are ranked as Top or Bottom 10, then any Top or Bottom 10 values are displayed. The values are displayed based on count (not based on rank).
Note
Calls having poor audio quality, major silence and abruptly disconnected are not considered in calculating the Agent score as it might affect the accuracy of the score.
Business Rule Analysis
Business Rule Analysis Reports display reports related to Reportable Business Rules which are also selected as the score component for the Business Goal. Analyst needs to select the reportable Business Rule to view the corresponding reports. Root Node and Standalone nodes (without child nodes) can be selected for BR Analysis.
These reports are goal-specific reports and display the Business Rules Hit % for the business rules for the selected time period. These reports are available at an aggregated level across all Agent groups or for specific Agent group.
Select Key Performance Indicators > Business Rule Analysis. The Business Rule Analysis chart is displayed.
Select the Reportable Business Rule to be analyzed from the drop-down list, if required.
By default, the number of contacts for the selected date period for which the reports are displayed is indicated.
Select the Period (Week, 2 Weeks, Month, Custom Range) from the Calendar. By default, the reports are displayed for the last selected date in any reports section for the first Business Rule.
Select the From date and To date in which the report is to be generated in the respective fields.
Note
System allows BA to select maximum of 1year date range and allow user to select for previous 2 years.
Select Contact Type - Voice, Chat or Email from the drop-down list. The values selected for Contact Type are be remembered by the system during the session in the Reports module when logged in. Selection of single or multiple contact types are allowed while filtering. By default, the Contact Type is played as All Contacts.
Click Filter button to select any of the options including Business Rule, Score, Call Attributes or Metadata. This filter is not mandatory.
Click Apply button to save the change in Filter.
Click Download (
) icon to download the chart in .png format.Click Favourite (
) to mark the chart as Favourite.Click Drill Down (
 ) icon to drill through child business rule analysis.
Note
Analyst can zoom in and zoom out each chart.
Call Duration and Call Hold Duration are displayed in HH:MM:SS.
Any bar or trend value from a BR Analysis report can be drilled down further to a list of calls on Call Analysis screen.
Business Rule hits, weekly trends and its distribution appear with charts.
Business Rule Analysis Charts:
Chart | Chart Title | Example |
|---|---|---|
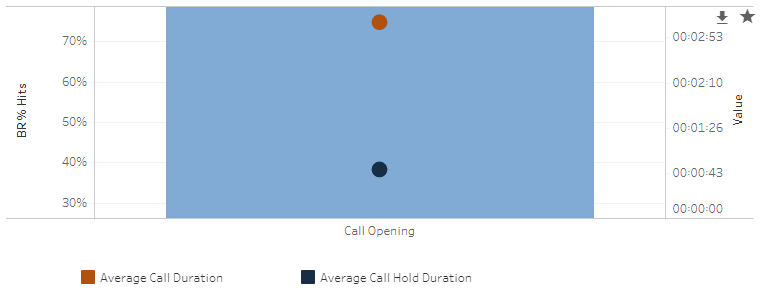
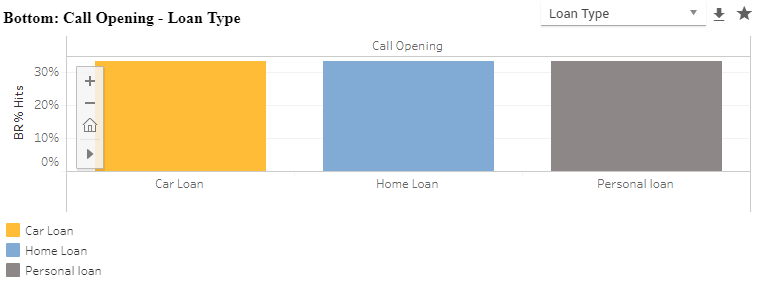
| <Business Rule> | Call Opening |
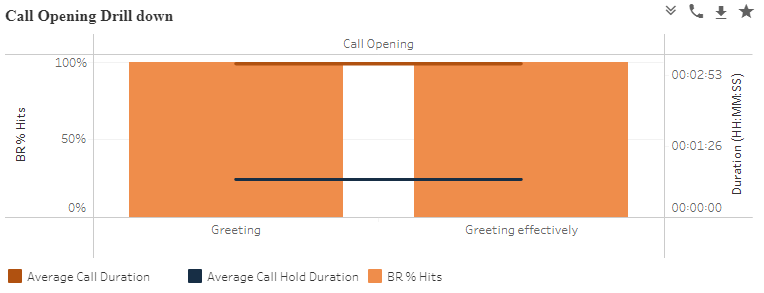
| Business Rule - Drill down | Call Opening Drill down |
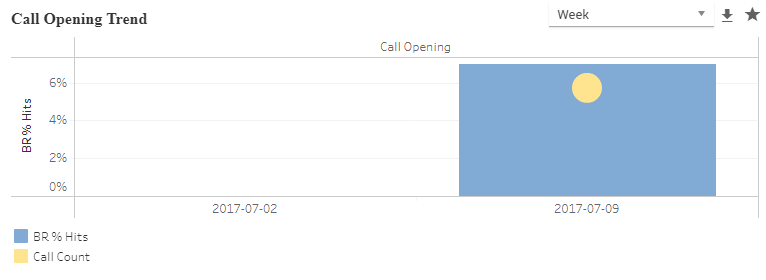
| Business Rule - Trend | Call Opening Trend |
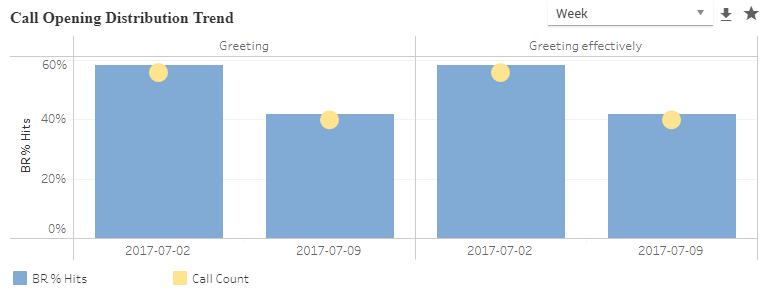
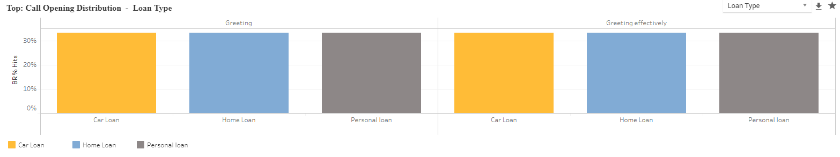
| Business Rule - Distribution Trend | Call Opening Distribution Trend |
| Top: Business Rule - Metadata | Top: Call Opening - Loan Type |
| Bottom: Business Rule - Metadata | Bottom: Call Opening - Loan Type |
| Top: Business Rule - Distribution - Metadata | Top: Call Opening Distribution - Loan Type |

Business Rule Analysis
Important
From version 2024.1.1 onwards the Business Rule Analysis Reports are available only for users using U-Analyze On-prem/Ansible deployments and is not available for U-Analyze X on cloud deployments.
Business Rule Analysis Reports display reports related to Reportable Business Rules which are also selected as the score component for the Business Goal. Analyst need to select the reportable Business Rule to view the corresponding reports. Root Node and Standalone nodes (without child nodes) can be selected for BR Analysis.
These reports are goal-specific reports and display the Business Rules Hit % for the business rules for the selected time period. These reports are available at an aggregated level across all Agent groups or for specific Agent group.
Select Key Performance Indicators > Business Rule Analysis. The Business Rule Analysis chart is displayed.
Select the Reportable Business Rule to be analyzed from the drop-down list, if required.
By default, the number of contacts for the selected date period for which the reports are displayed is indicated.
Select the Period (Week, 2 Weeks, Month, Custom Range) from the Calendar. By default, the reports are displayed for the last selected date in any reports section for the first Business Rule.
Select the From date and To date in which the report is to be generated in the respective fields.
Note
System allows BA to select maximum of 1year date range and allow user to select for previous 2 years.
Select Contact Type - Voice, Chat or Email from the drop-down list. The values selected for Contact Type are remembered by the system during the session in the Reports module when I am logged in. Selection of single or multiple contact types are allowed while filtering. By default, the Contact Type is displayed as All Contacts.
Click Filter button to select any of the options including Business Rule, Score, Call Attributes or Metadata. This filter is not mandatory.
Click Apply button to save the change in Filter.
Click Download (
) icon to download the chart in .png format.Click Favourite (
) to mark the chart as Favourite.Click Drill Down (
) icon to drill through child business rule analysis.Note
Analyst can zoom in and zoom out each chart.
Call Duration and Call Hold Duration are displayed in HH:MM:SS
Any bar or trend value from a BR Analysis report can be drilled down further to a list of calls on Call Analysis screen.
Business Rule hits, weekly trends and its distribution appears with charts.
Business Rule Analysis Charts:
Chart | Chart Title | Example |
|---|---|---|
| <Business Rule> | Call Opening |
| <Business Rule> Drill down | Call Opening Drill down |
| <Business Rule> Trend | Call Opening Trend |
| <Business Rule> Distribution Trend | Call Opening Distribution Trend |
| Top: <Business Rule> - <Metadata> | Top: Call Opening - Loan Type |
| Bottom: <Business Rule> - <Metadata> | Bottom: Call Opening - Loan Type |
| Top: <Business Rule> Distribution - <Metadata> | Top: Call Opening Distribution - Loan Type |
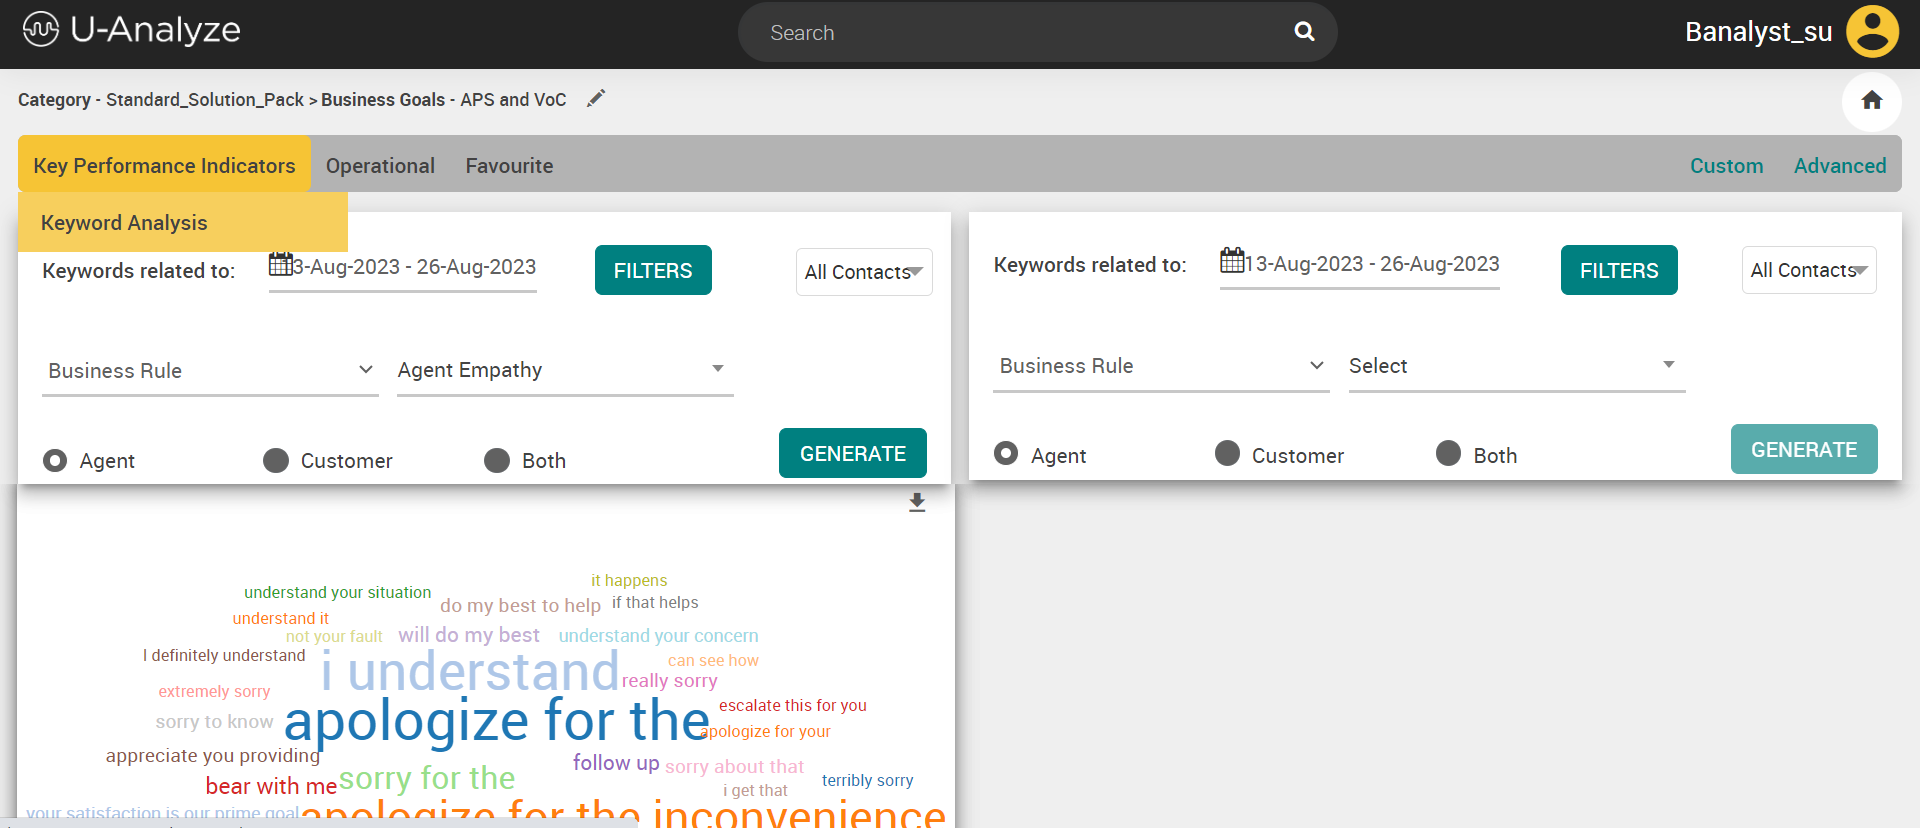
Keyword Analysis
This feature allows the Analyst to view and download a Keyword Cloud which is a visual representation of key phrases spoken during the call for the selected Reportable Business Rule or Business Rule Group. If Analyst selects a Parent BR, by default, system displays the keywords detected for the Parent BR and also all the keywords detected for its Child BRs (at all levels). The keywords are displayed in horizontal direction from left to right.
Note
This feature is available for users of both On-premise and X on cloud deployments.
Select Key Performance Indicators > Keyword Analysis.
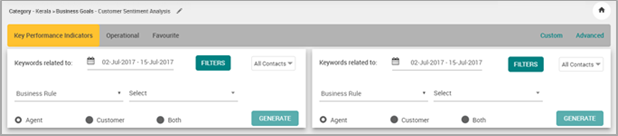
Select the option as ‘Business Rule’ or ‘Business Rule Group’. Based on the selection, a list of business rules or business rule groups are available in the drop-down list.
Select Agent, Customer or Both by clicking the radio button.
For Mono Audio files, Both channel option is selected by default.
For Mono (with Diarization) and Stereo Audio Files, Analyst can select Agent, Customer or Both channel for Business Rule to be evaluated in a specific channel or for any channel.
Select the Period (Week, 2 Weeks, Month, Custom Range) from the Calendar.
Select the From date and To date in which the report is to be generated in the respective fields.
Note
System allows BA to select maximum of 1 year date range and allow user to select for previous 2 years.
Click Filter button to select any of the options including Business Rule, Score, Call Attributes or Metadata. This filter is not mandatory.
Click Apply button to save the change in Filter.
Select Contact Type - Voice, Chat or Email from the drop-down list. The values selected for Contact Type are remembered by the system during the session in the Reports module when logged in. Selection of single or multiple contact types are allowed while filtering. By default, the Contact Type is displayed as All Contacts.
Click Generate button. The Keyword Cloud report appears as shown below.
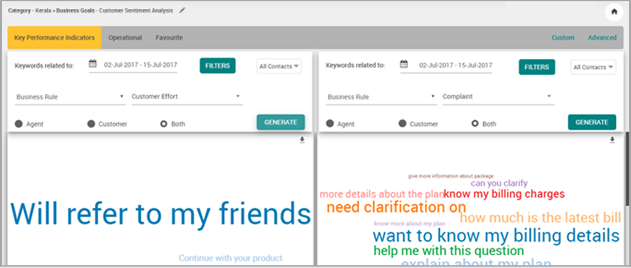
Click Download (
) icon to download the keyword cloud in PNG format.