Custom Reports
Custom Reports are created from a set of pre-defined reports which enable the Analyst to slice and dice, perform deeper analysis, perform correlations across Reportable Business Rules, Scores, Metadata, Call Attributes like Call Duration, Call Hold, etc. These reports are category specific.
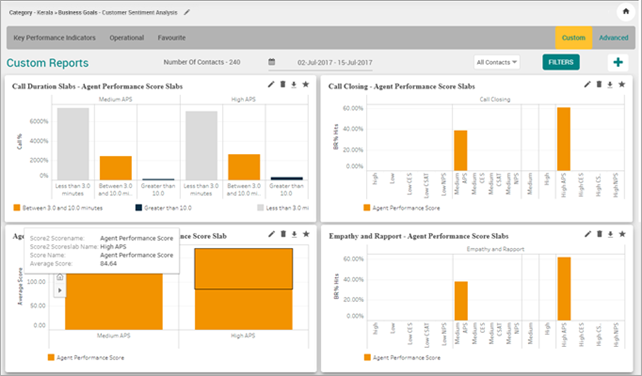
Click Custom tab. The Custom Reports are displayed as shown below.
Click on the report and select the parameters, dimensions or measurements.
Click OK button to generate and display the custom report.
By default, the number of contacts for the selected date period for which the reports are displayed is indicated.
Select the Period (Week, 2 Weeks, Month, Custom Range) from the Calendar. By default, the reports are displayed for the last selected date in any reports section for the first Business Rule.
Select the From date and To date in which the report is to be generated in the respective fields.
Note
System allows BA to select a maximum of 1 year date range and allows user to select for previous 2 years.
Select Contact Type - Voice, Chat or Email from the drop-down list to filter custom reports. The values selected for Contact Type is remembered by the system during the session in the Reports module when logged in. Selection of single or multiple contact types is allowed while filtering. By default, the Contact Type is displayed as All Contacts.
Click Filter button to select any of the options including Business Rule, Score, Call Attributes or Metadata. This filter is not mandatory.
Click Apply button to save the changes to the Filter.
Click Download (
 ) icon to download the chart in PNG format.
Click Favorite (
 ) icon to mark the chart as Favorite.
Click Edit (
 ) icon to edit the custom chart.
Click Delete (
 ) icon to delete the custom chart.
Add Custom Chart
Click Add (
 ) button to create a new Custom Report. A pop-up opens up with pre-defined images of the charts. Find the below list of charts.
Chart
Chart Title
Example
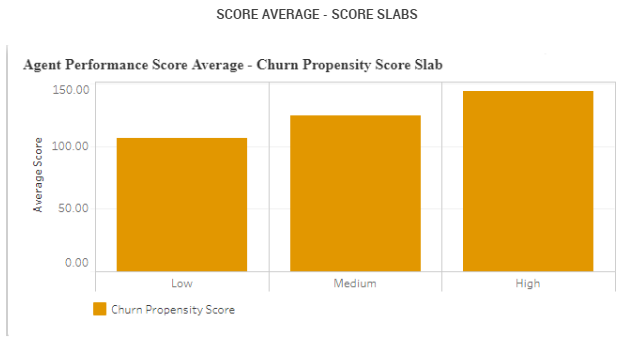
Score Average - Score Slabs
Agent Performance Score Average - Agent Performance Score Slabs
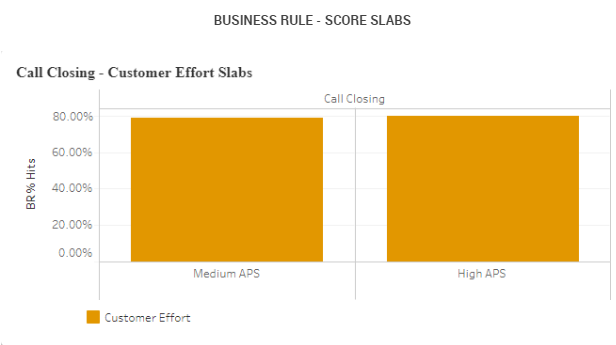
Business Rule - Score Slabs
Soft Skills - Agent Performance Score Slabs
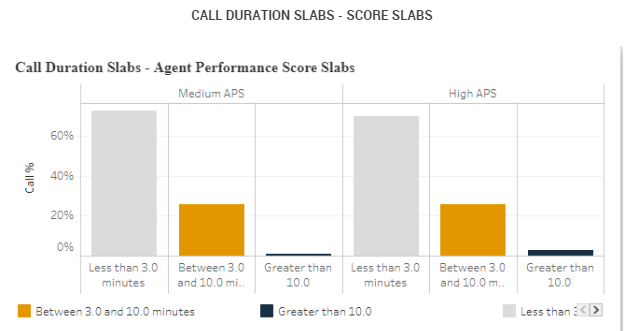
Call Duration Slabs - Score Slabs
Call Duration Slabs - Agent Performance Score Slabs
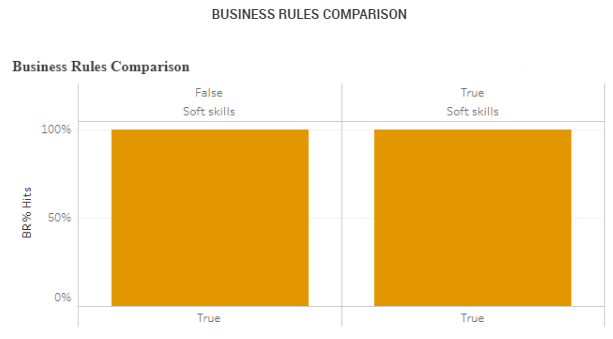
Business Rules Comparison
Business Rules Comparison
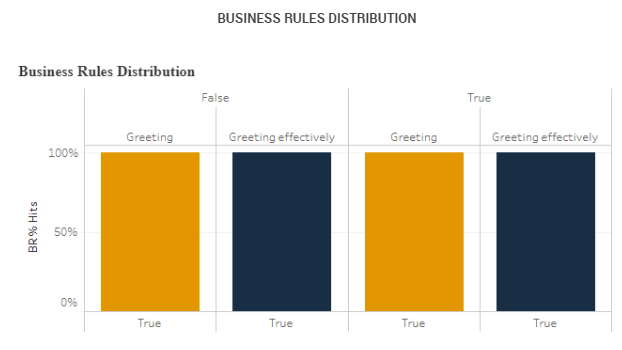
Business Rules Distribution
Business Rules Distribution
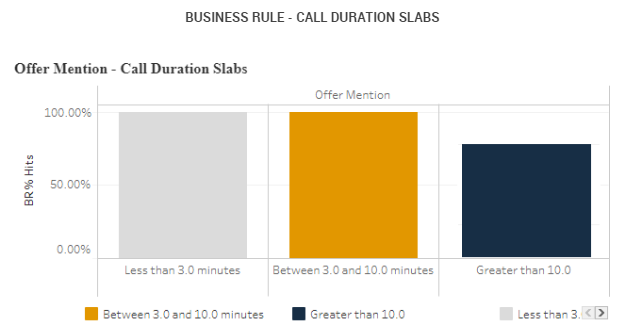
Business Rule - Call Duration Slabs
Irate Customer - Call Duration Slabs
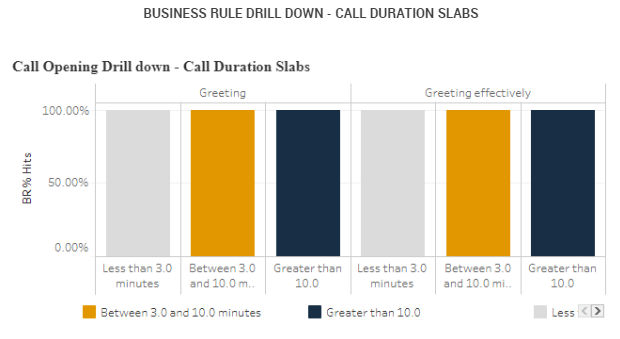
Business Rule Drill down - Call Duration Slabs
Call Opening Drill down – Call Duration Slabs
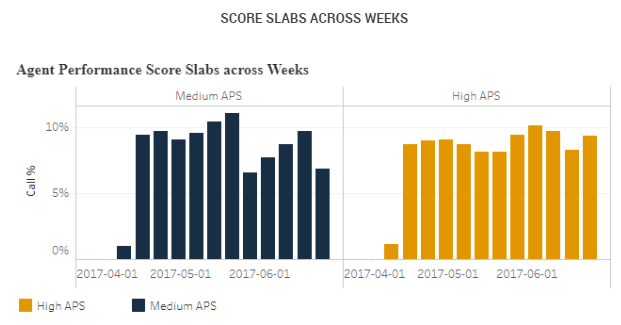
Score Slabs across Weeks
Agent Performance Score Slabs across Weeks
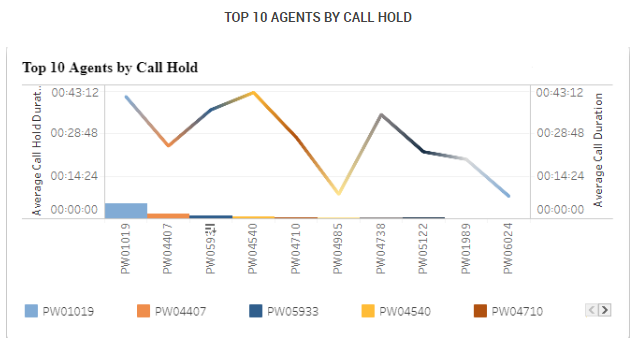
Top 10 Agents by Call Hold
Top 10 Agents by Call Hold
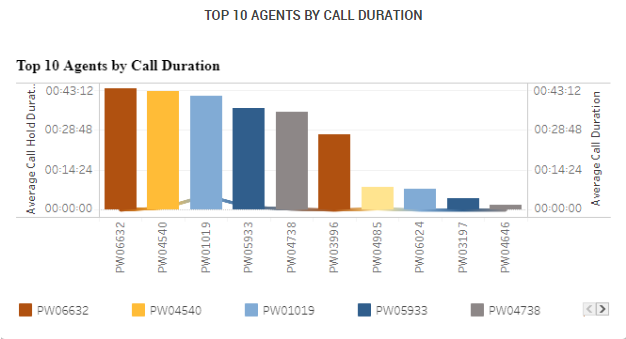
Top 10 Agents by Call Duration
Top 10 Agents by Call Duration
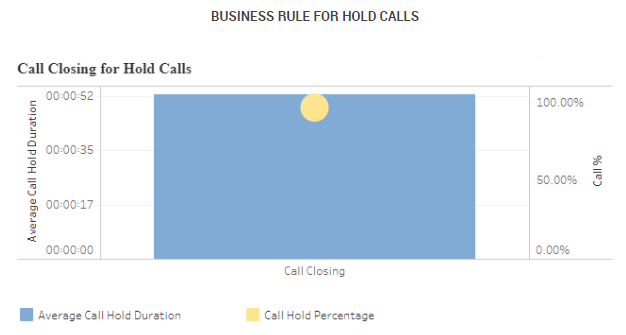
Business Rule for Hold Calls
Call Closing for Hold Calls

Business Rule Drill down for Hold Calls
Call Opening Drill down for Hold Calls
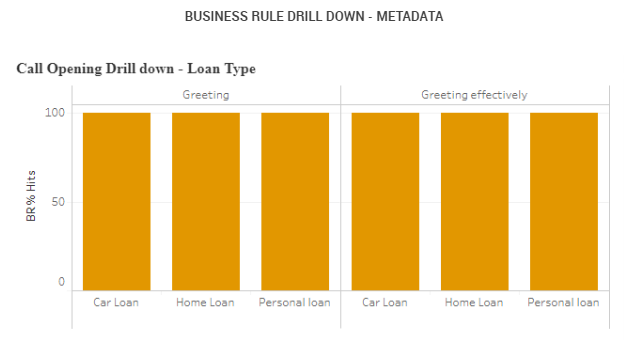
Business Rule Drill down - Metadata
Call Opening Drill down - Loan Type
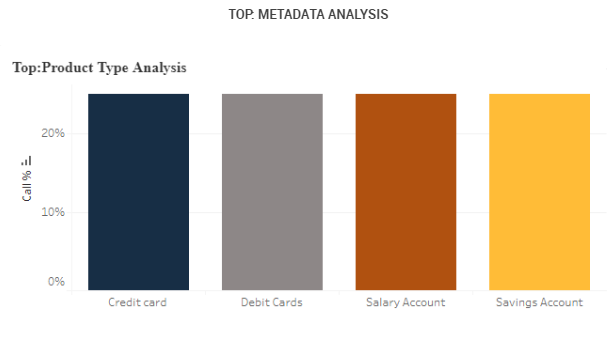
Top: Metadata Analysis
Top: Loan Type Analysis
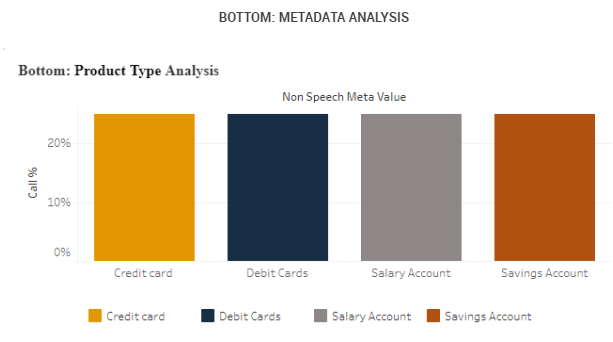
Bottom: Metadata Analysis
Bottom: Loan Type Analysis

Metadata Trend Analysis
Loan Type Trend Analysis
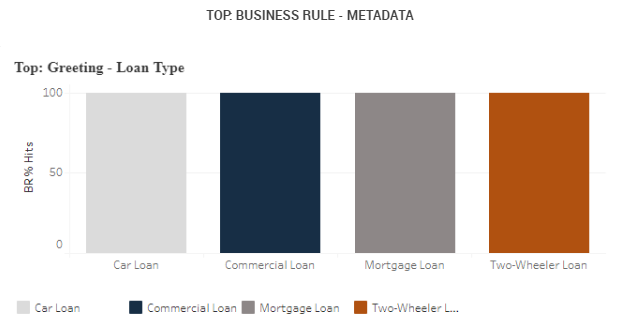
Top: Business Rule - Metadata
Top: Call Closing - Loan Type
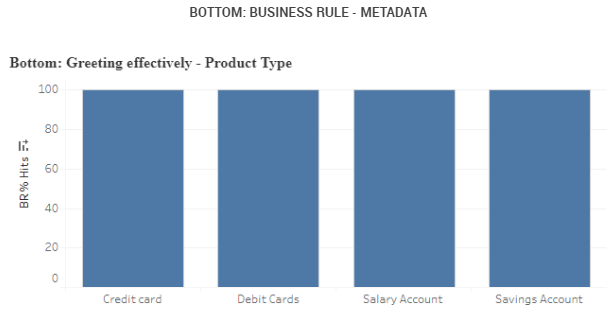
Bottom: Business Rule - Metadata
Bottom: Call Closing - Loan Type
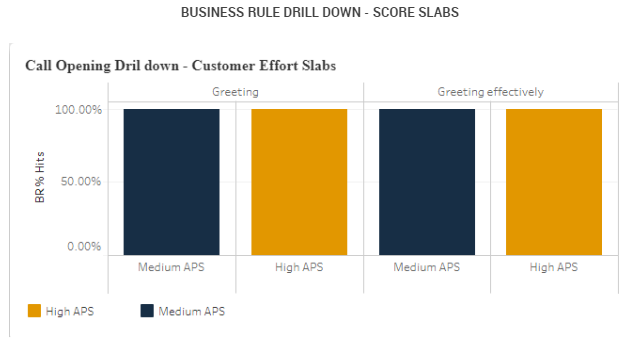
Business Rule Drill down - Score Slabs
Call Opening Drill down - Agent Performance Score Slabs
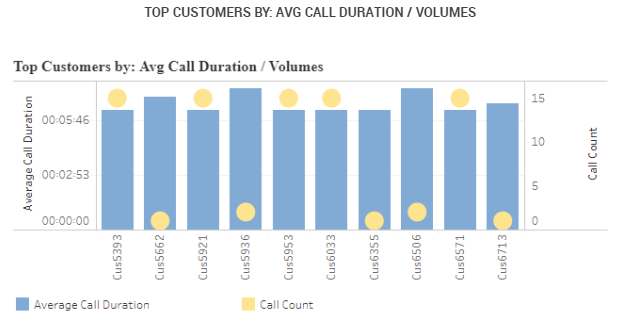
Top Customers by: Avg Call Duration / Volumes
Top Customers by: Avg Call Duration / Volumes

Bottom Customers by: Avg Call Duration / Volumes
Bottom Customers by: Avg Call Duration / Volumes
Click on the chart, a small pop-up opens up for selection of parameters (like Business Rules, Scores, Metadata, etc.).
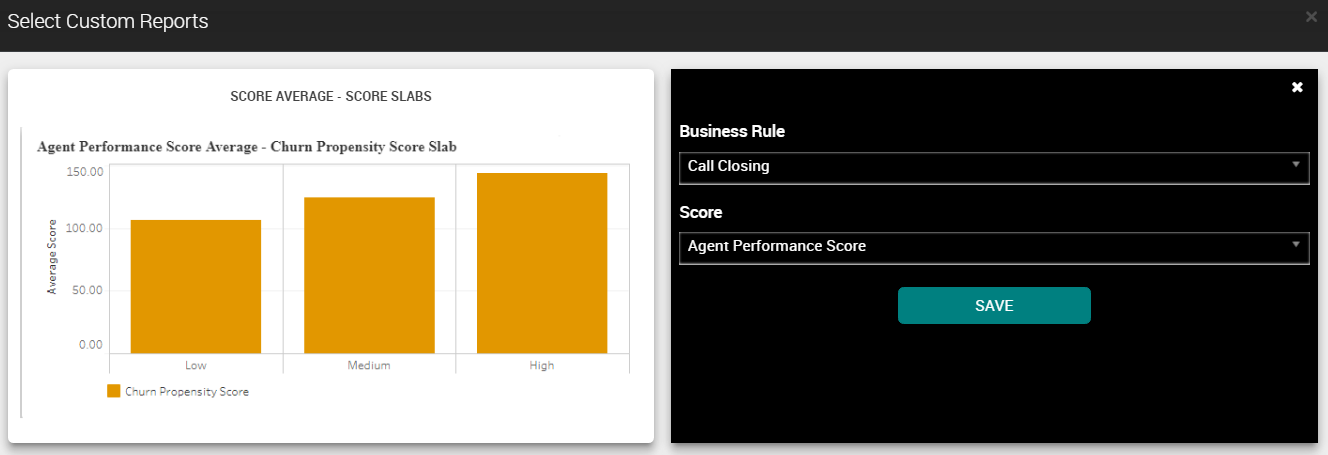
Selects the parameters and click Save button to view the newly generated Report. The latest created charts are displayed first.
Note
System allows analyst to create a maximum of 36 custom charts.