Advanced Reports
Advanced Reports are organization-specific and available across Categories. The system allows analysts to create charts across Categories in Advanced Reports. Through Advanced Reports, analysts can download Call-wise, Score-wise, and Reportable BR-wise details in CSV format to create additional reports for analysis.
Analysts can create the below reports with Advanced Visualization for different contact types.
Create custom reports with Chat and Email Business Rule values and Scores.
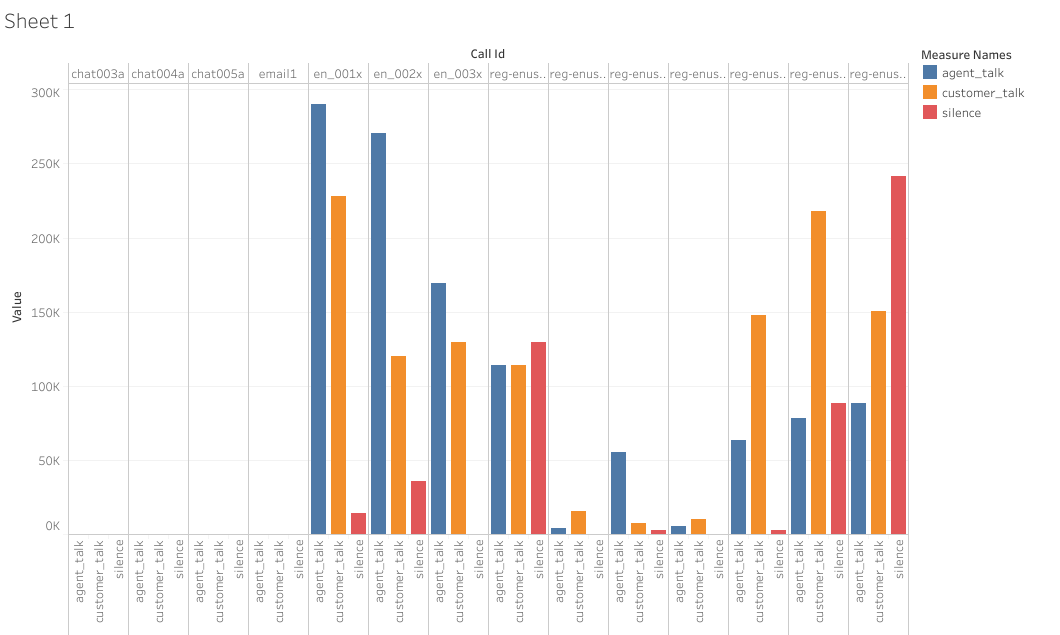
Create custom reports with interaction overview donut chart speech attributes (i.e., Customer Talk, Agent talk, Agent Talkover, Hold music, Hold music talkover, and Silence. This enhancement is provided from release 2024.1 onwards. An example of a custom report that shows the interaction overview donut chart speech attributes is shown below for reference:
Create reports with metadata of all the contact types including voice, chat, and email.
Create reports for comparative analysis between APS scores, Negative Sentiment across different Contact Types.
Create reports for correlation analysis between the contact types and other attributes.
Create reports using the Overall Customer Sentiment for trend analysis, analyze the correlation between Sentiments and Metadata, analyze the correlation between sentiments across different regions, analyze the distribution of sentiment across calls, and more.
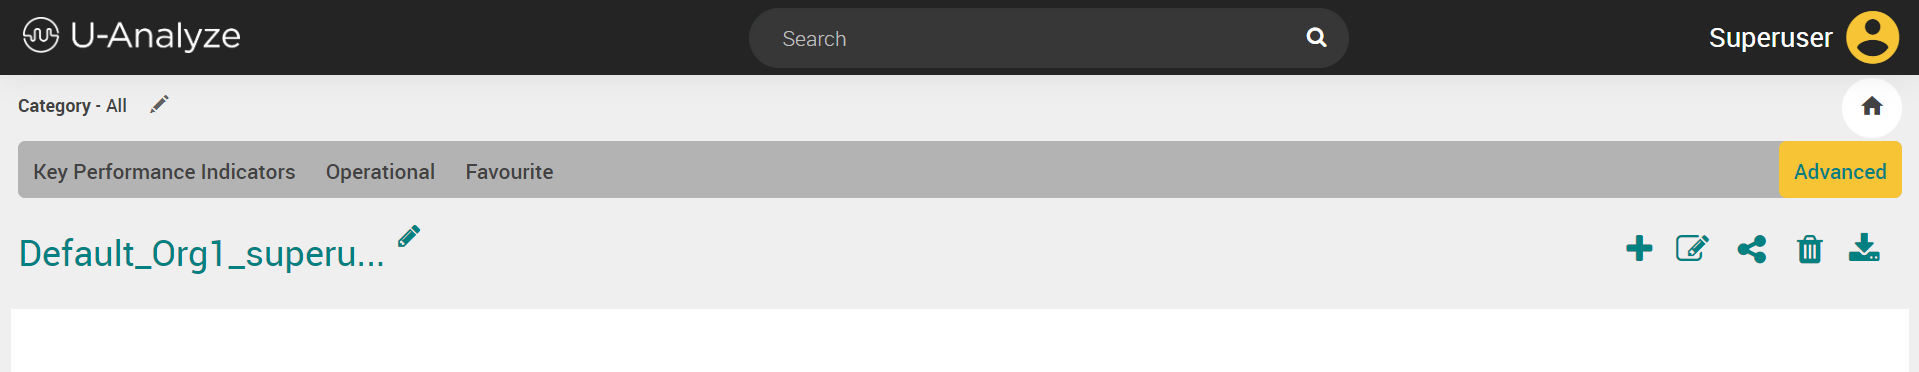
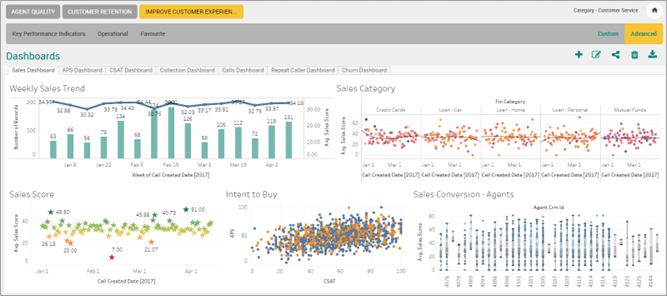
When you click the Advanced tab, by default, a blank workbook is created which is named as Default_<User Name> within U-Analyse’s report framework. The default workbook is listed under Advanced Reports.
Note
The list of fields in the Data Source is user-friendly.
Date Filters and Global Filters are not applicable for Advanced Reports.
The number of calls is not listed.
Advanced Reports are meant exclusively for the analysts in an organization.
Attributes Exposed to Advanced Reports
The advanced reports are generated based on the specific attributes that are exposed to it.
The attributes listed below are considered for advanced reports generation.
Fields | Comments |
|---|---|
Scores | All the created scores and slabs at the category level. A maximum of 50 scores is allowed. |
Reportable Business Rules | All the created reportable business rules at the category level. A maximum of 750 rules is allowed. |
Non-speech Metadata | All the inserted non-speech metadata at the category level. A maximum of 750 non-speech metadata is allowed. |
Call and Speech Attributes |
|
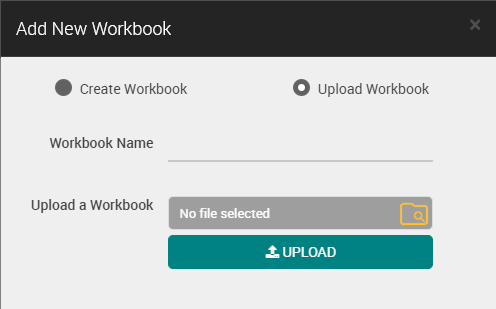
To Add New Workbook
Click Add icon to add a new workbook.
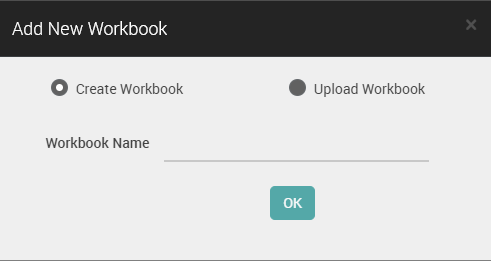
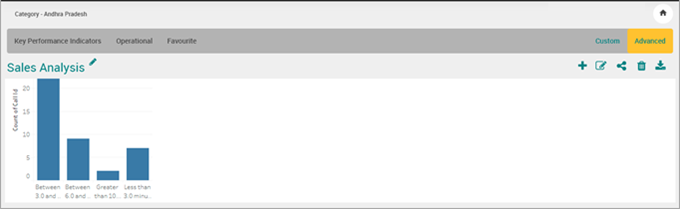
Enter the workbook name and click OK button. Newly created workbook is displayed under Advanced Reports.
Click Rename Workbook (
 ) icon to rename the workbook.
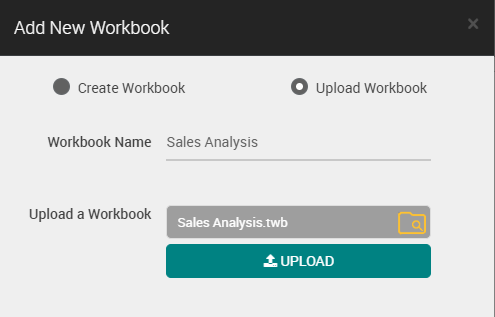
To Upload Workbook
Analyst can upload the workbook TWB (Tableau Workbook Files) format which is exported from Tableau in U-Analyze Conversations.
 |
Enter the workbook name and upload the workbook. Click on Upload button, the uploaded workbook is displayed under Advanced Reports.
 |
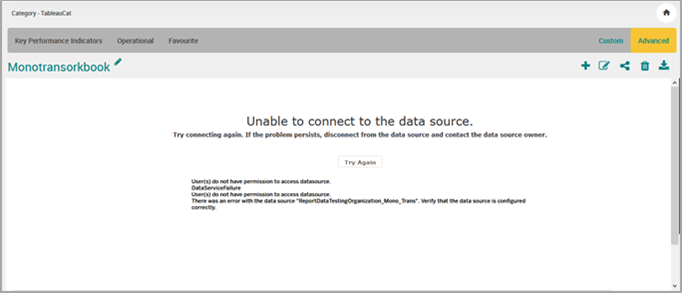
Note
When the user uploads the workbook, which is created under a category for which user does not have the access or when a workbook is getting uploaded, the system throws an error message “Unable to connect to the data-source” while viewing the report.
To Edit Workbook
Click Edit
 icon. Drag and drop the Dimensions and Measures from left pane to Columns and Rows to set the x-axis and y-axis for charts.
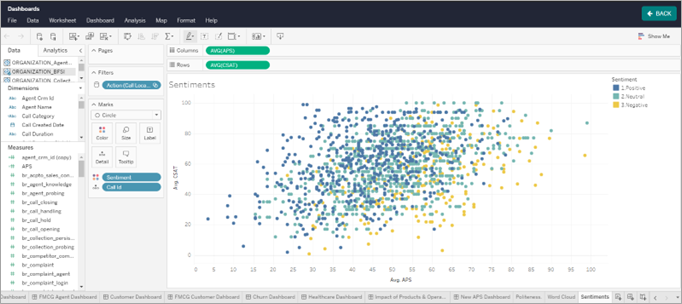
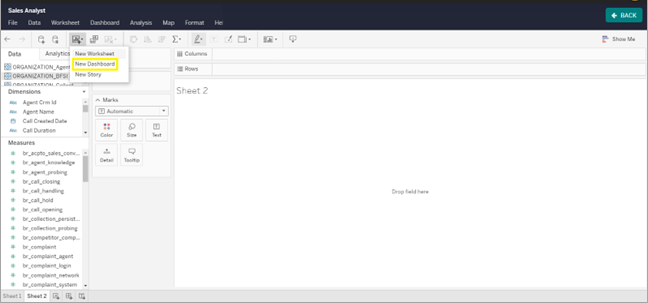
Select New Worksheet option to create a new worksheet.
The new worksheet is displayed as shown below. Drag and drop the Dimensions and Measures from left pane to Columns and Rows to set the x-axis and y-axis for charts.

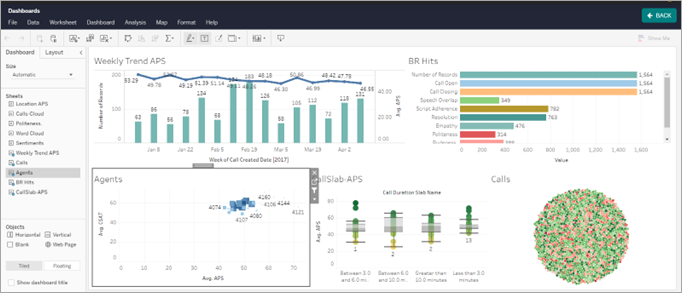
Select New Dashboard option to create a new dashboard.
In the Dashboard, drag and drop the created sheets from left pane to the page.
When a new category is created, it is be available in the existing workbooks. But the same category is available in the workbooks which are newly added after the category was created. Click New Data Source (
 ) icon to add the new category from the available data sources in edit mode. For example, if you create the category in the name of “support” it is available in the data source list.
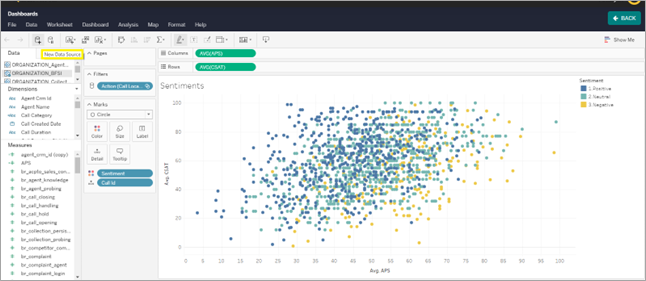
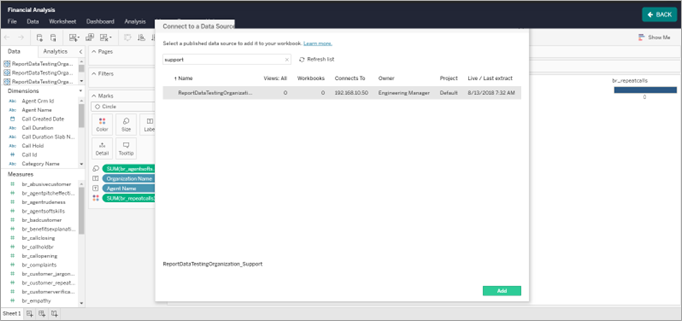
Click Add button. The newly added category will be included in the workbook.
When the category is deleted, it will remain in the existing workbooks where the data source was added. If Analyst tries to use any value from that category data source, a pop-up message will be displayed.
Right click on that Category in edit mode and select Close option to remove the category.
If Analyst wants to draw a chart across multiple categories, double click on the link (
 ) icon in Organization Name to link the category data sources.
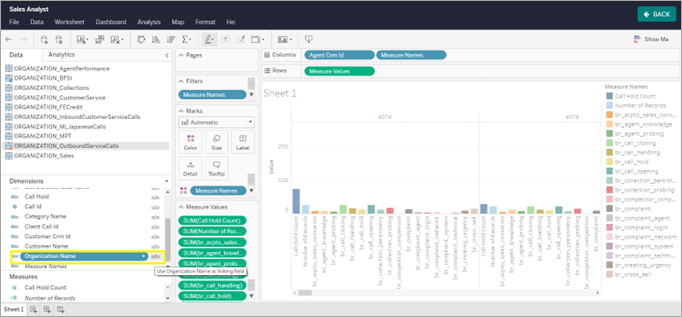
Note
The above-mentioned step must be done for every additional category used in a chart.
To Share Workbook with View Only Permission
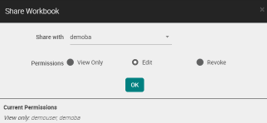
Click Share icon to share the workbook with other Analysts.
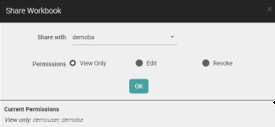
Select the Analyst with whom the workbook is to be shared.
Select View Only Permission option and click OK button.
When the Analyst with whom the workbook is shared logs in, the default workbook is displayed.
The shared workbook is available under Advanced reports. As only View permissions are given, Edit, Share and Delete icons are disabled.
To Share Workbook with Edit Permission
Click Share icon to share the workbook with other Analysts.
Select the Analyst with whom the workbook is to be shared.
Select Edit option and click OK button.
When the Analyst with whom the workbook is shared logs in, the default workbook is displayed.
The shared workbook is available under Advanced Reports. Analyst can edit the workbook but cannot share and delete.
Note
The Chart and Workbook name changes are reflected in the workbooks of the owners and all the other Analysts with whom the same workbook has been shared. Only the owner of the workbook can share the workbook.
To Share Workbook with Revoke Permission
Select the workbook to be revoked under Advanced Reports. The Share Workbook pop-up is displayed.
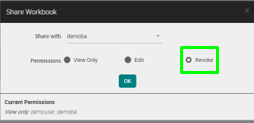
Select the Analyst from whom the workbook needs to be revoked.
Select Revoke option and click OK button.
When the Analyst with whom the workbook is revoked logs in, the default workbook is displayed.
The workbook which is revoked is not available in the menu and in Advanced reports.
Note
Workbook with whom the Analyst has been shared with either Edit or View only permissions can be revoked. Revoke option is enabled only when workbook is already shared with Analyst.
When Admin deletes an Analyst who has shared advanced Reports (workbooks), system displays a delete confirmation message.
To Drill Down to Contact Level
System allows Analyst to drill down to list of contacts from any of the displayed bar values of Advanced Reports which is created in Tableau to view the details of a Call, Chat, and Email. Analyst can further drill down into the contact level transcript and key words used within the calls by clicking on the specific call ID.
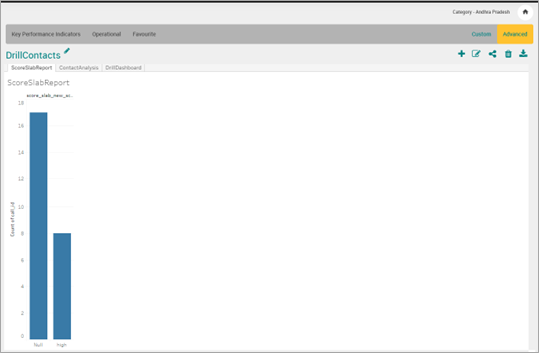
Click on any of the displayed bar in this Score Analysis chart to drill down to Contact Analysis.
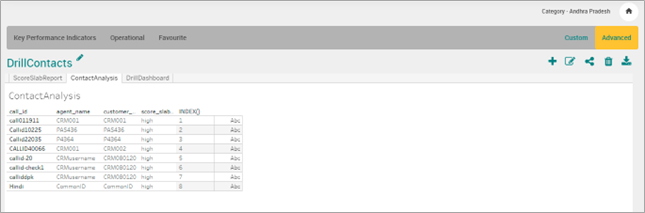
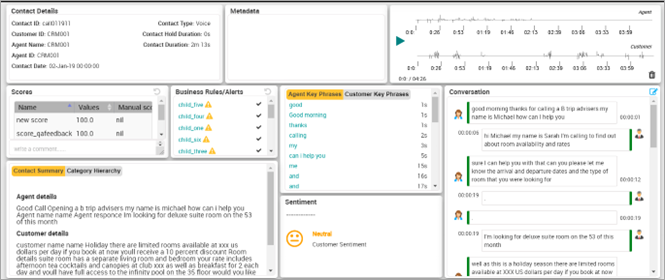
Click the call ID to get the interaction details with Scores, Business Rules/Alerts, Keyphrases and Metadata.
Refer to the section Drill Down from Advanced Reports to Contact Level in Create Reports in Tableau Desktop.
Drill Down to Child Business Rules from Advanced Report
Analyst can drill down to Business Rule hierarchies within the same chart to analyze number of corresponding child business rules hits.
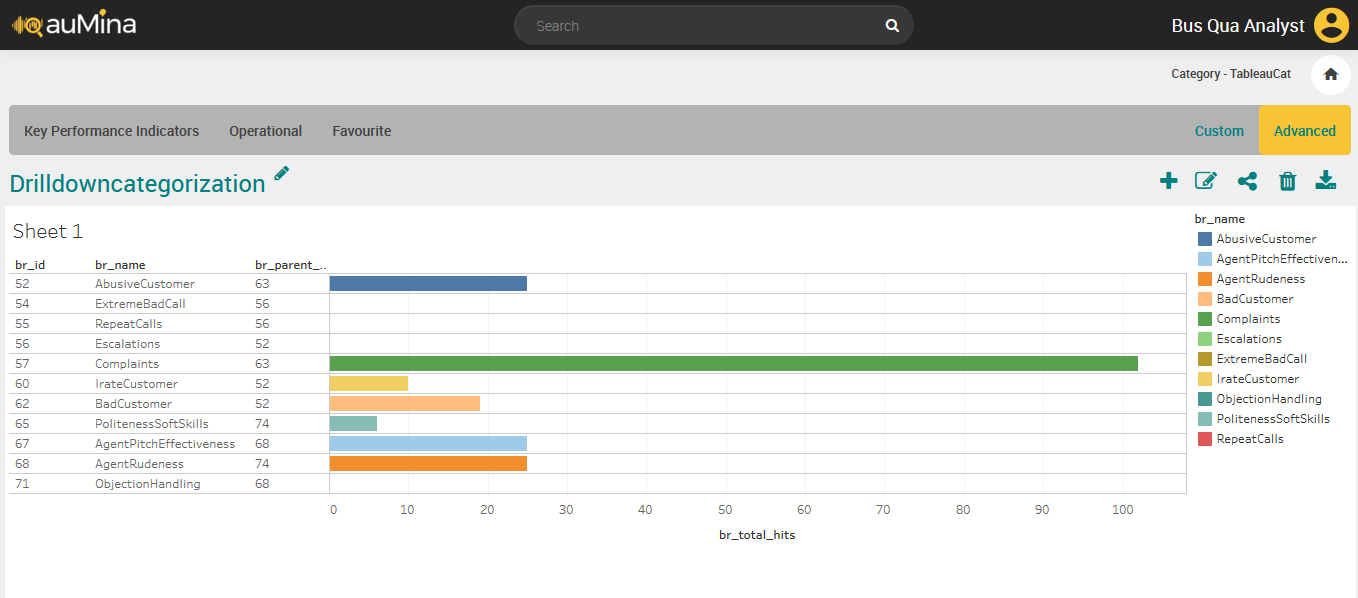 |
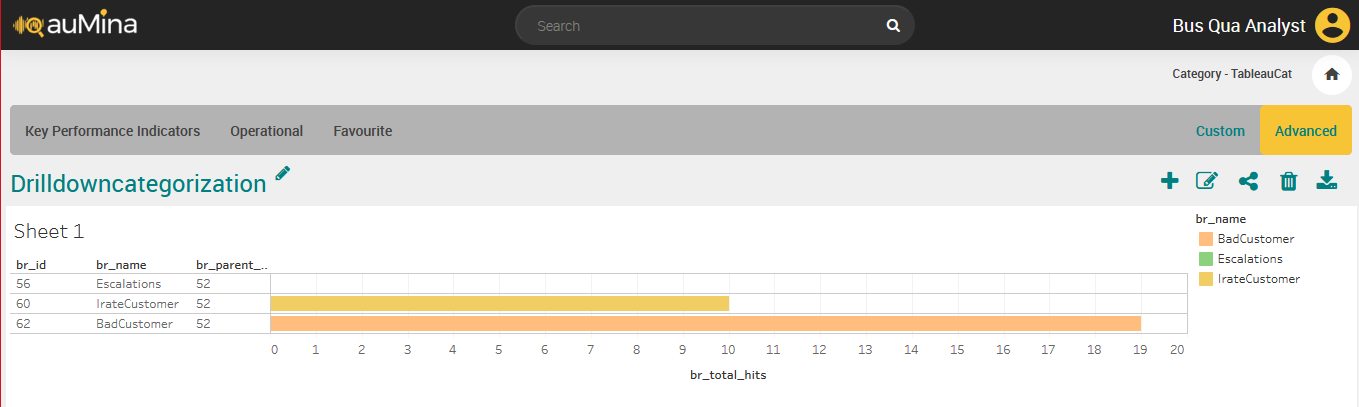
Click on any bar value to drill down to number of child business rules hits.
 |
Refer to the section Drill down to business rule hierarchies.
Create Reports in Tableau Desktop
Analyst can create individual contact level analysis chart and business rule hierarchies drill down chart in the Tableau Desktop.
For these charts, Tableau Desktop (Licensed version) will be required.
Prerequisites
Windows_Server-2019 - Tableau desktop
Tableau Server 2022.1.9.
Drill down from Advanced reports to Contact level
Follow the below steps to create reports in Tableau Desktop and drill down to Interaction Details from Tableau workbook.
Connect to a data source - Tableau Server. Tableau desktop needs to be installed in the system which must have access to Tableau Server URL.
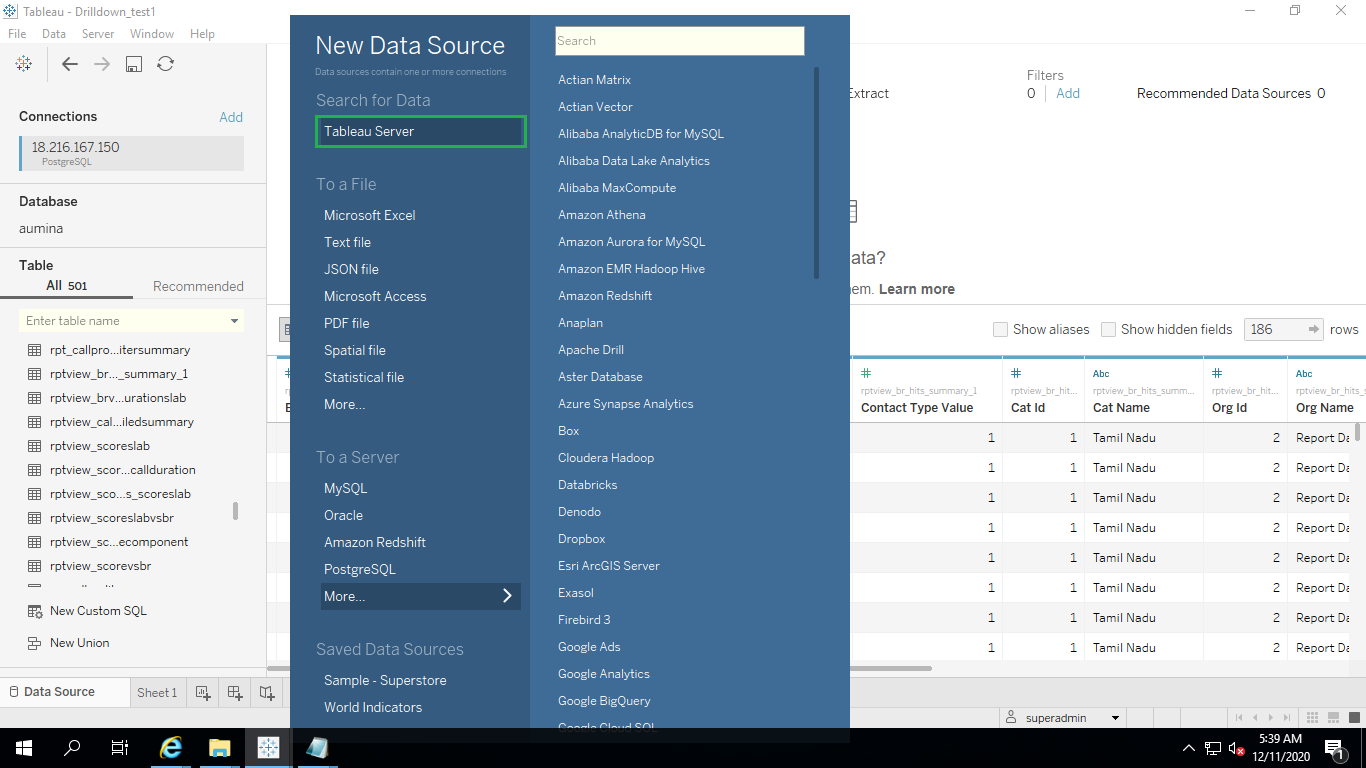
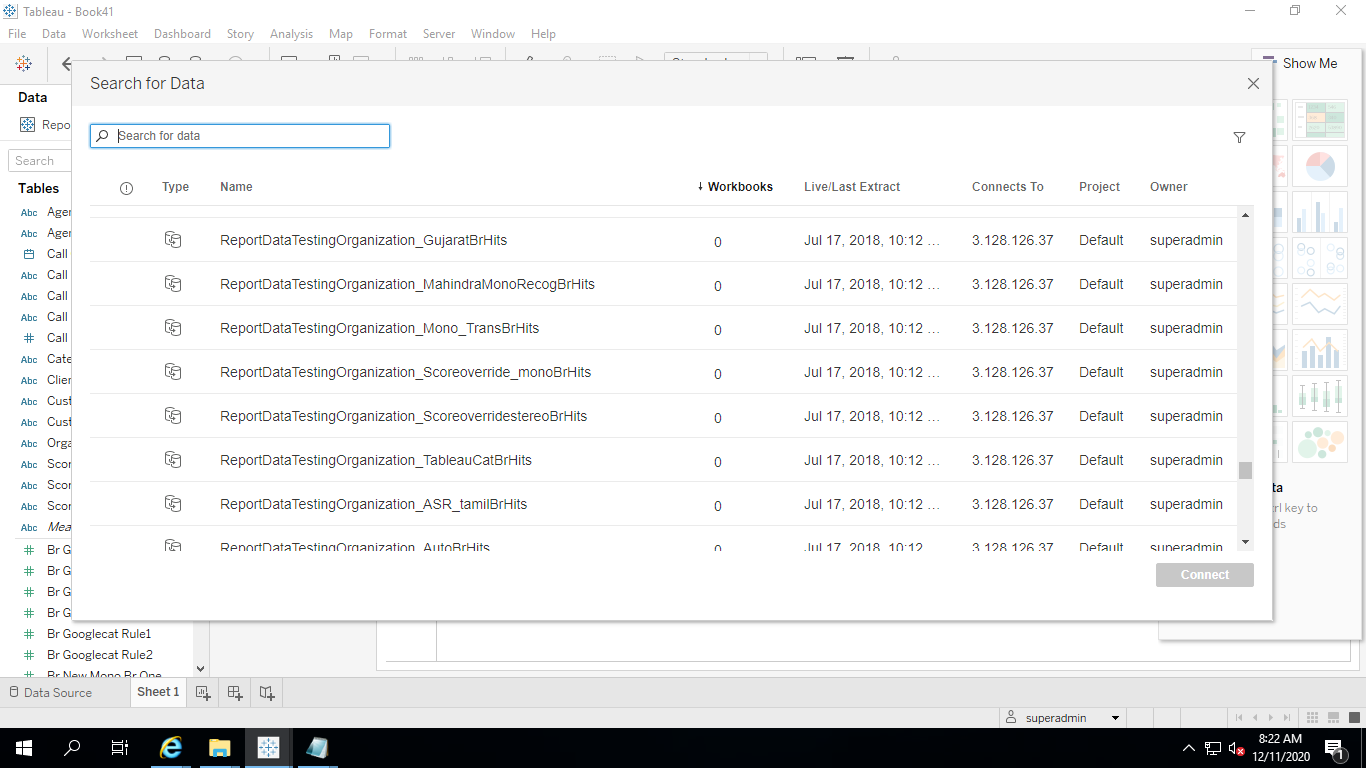
Select the datasource from the tableau server existing data sources. Data source name will be in the format of Organizationname_categoryname. Click Connect button.
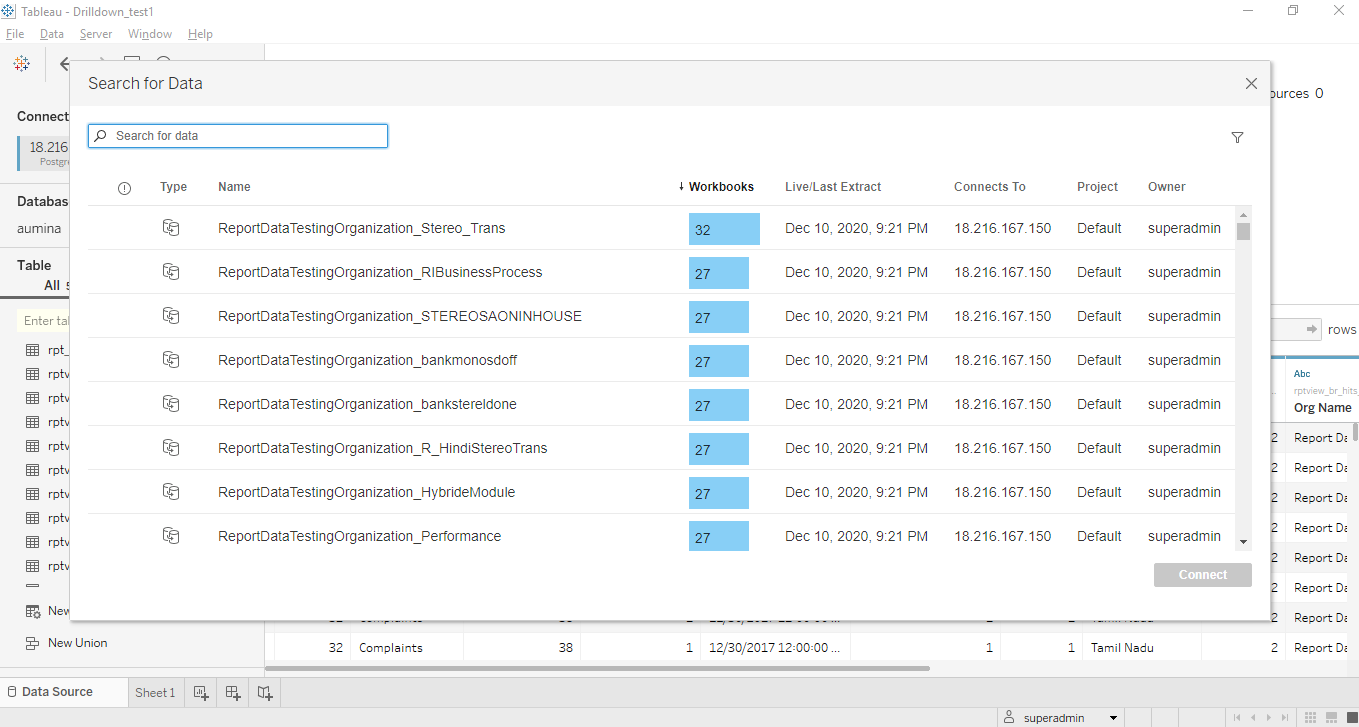
Reports created in a specific data source (for example: Sales category under XXX organization) will be published by the analyst who have access to this category.
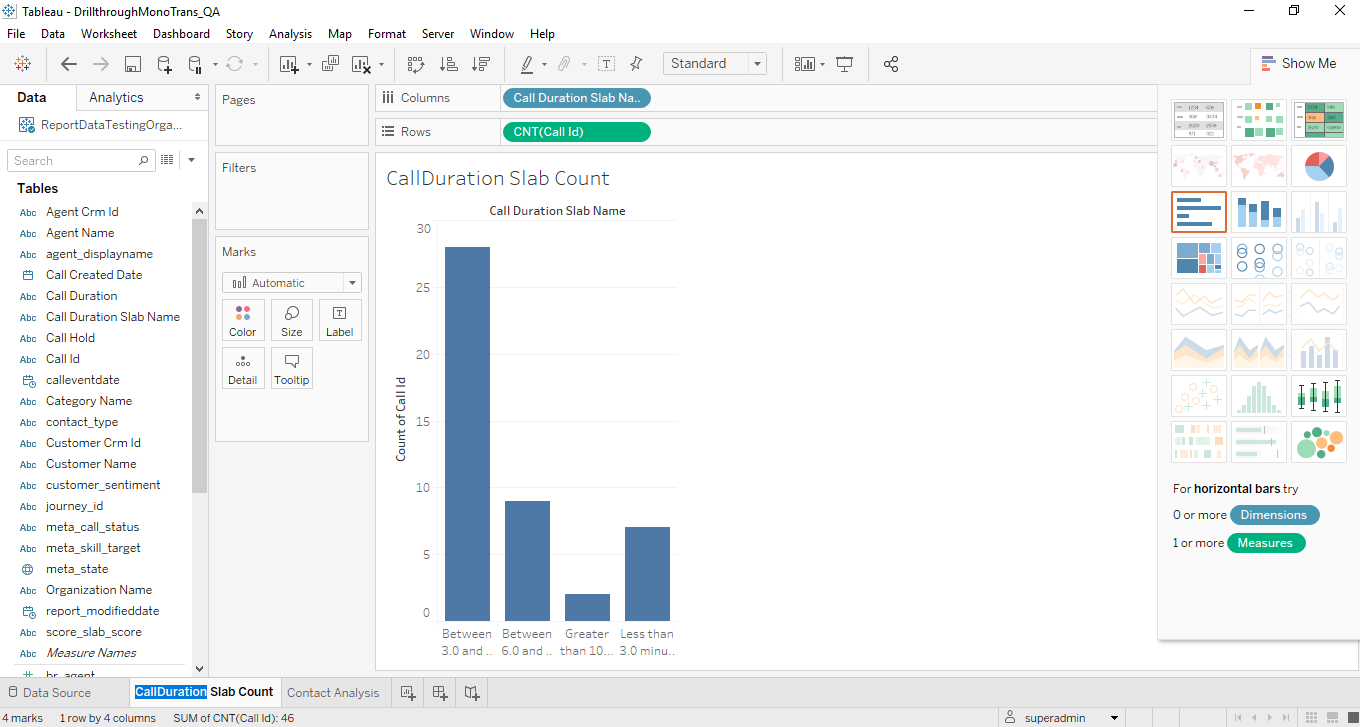
Create any chart in Tableau desktop based on the requirement. Drag and drop the Dimensions from left pane to Columns and Rows to set x-axis and y-axis for charts. Two sheets are required to create contact analysis chart. Call Duration and Call ID will be mandatory in the Sheet 1; other Dimensions and Measures are optional.
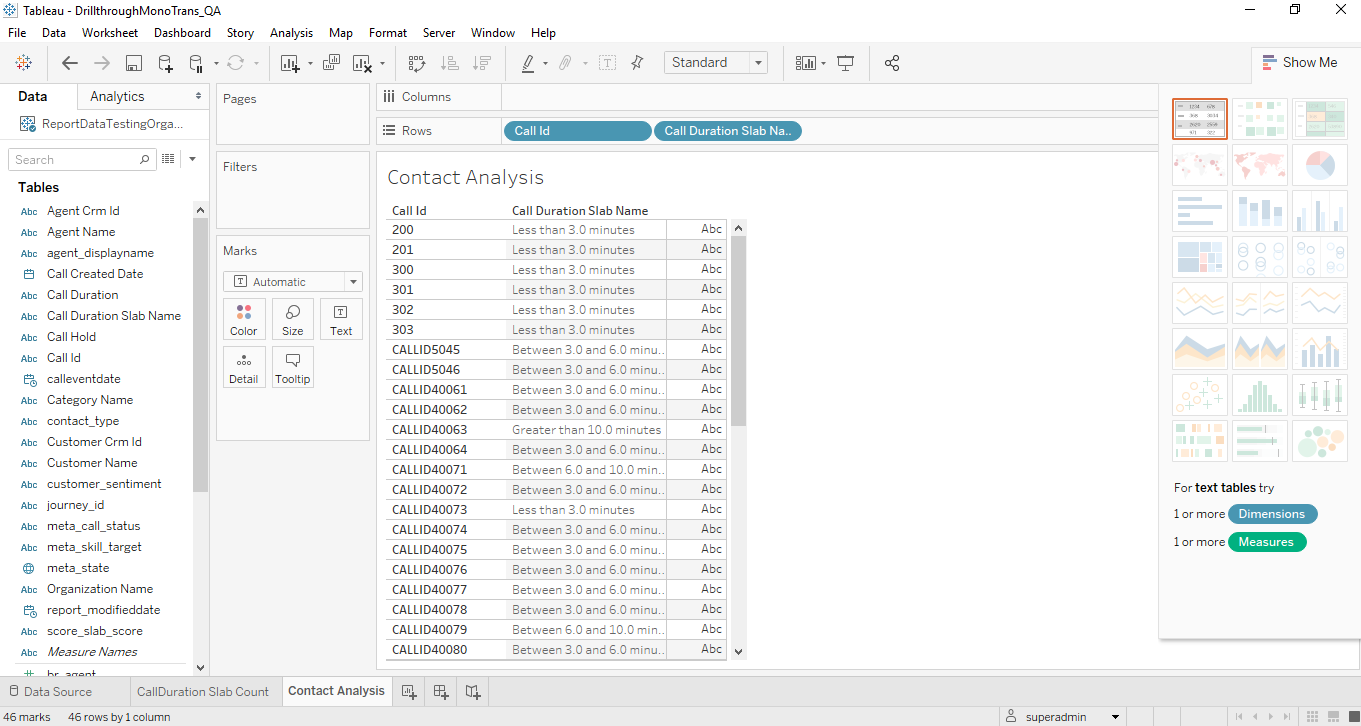
In the Sheet 2, Call ID is mandatory; other Dimensions and Measures are optional.
Go to Worksheet > Actions.
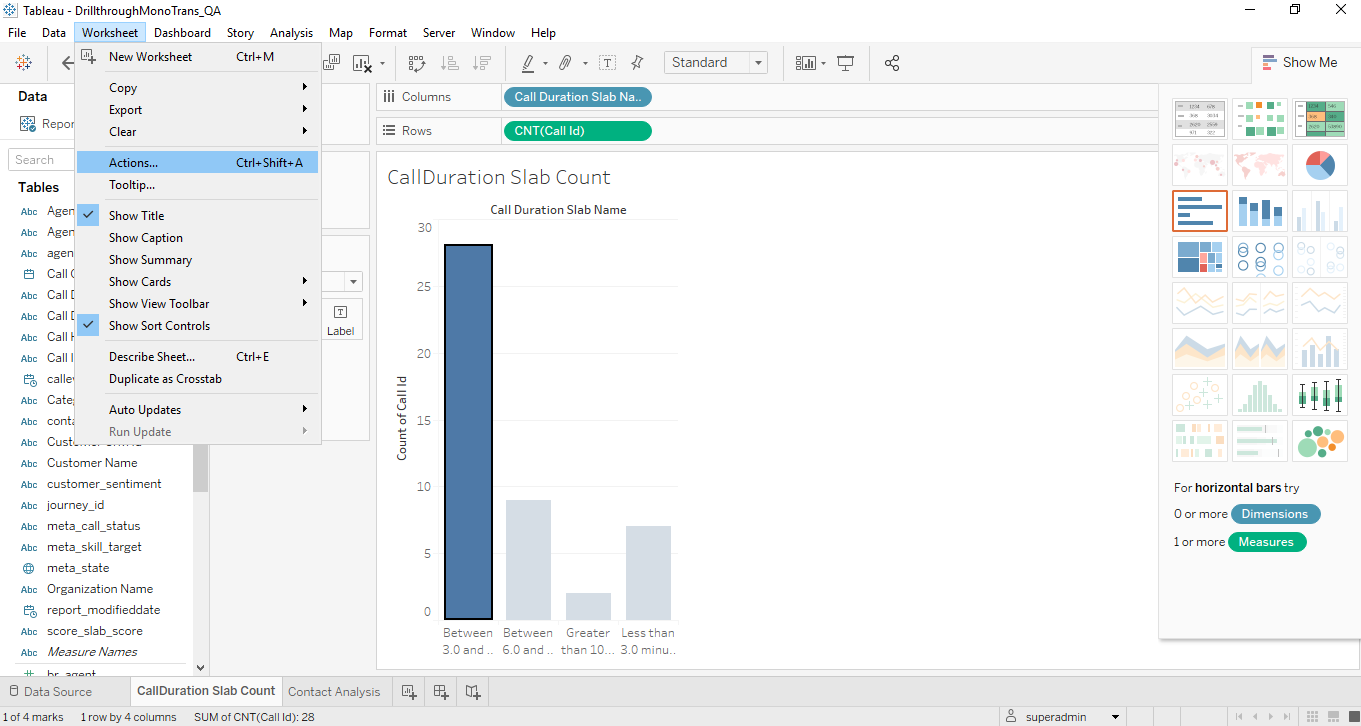
Click Add Action and select Filter.
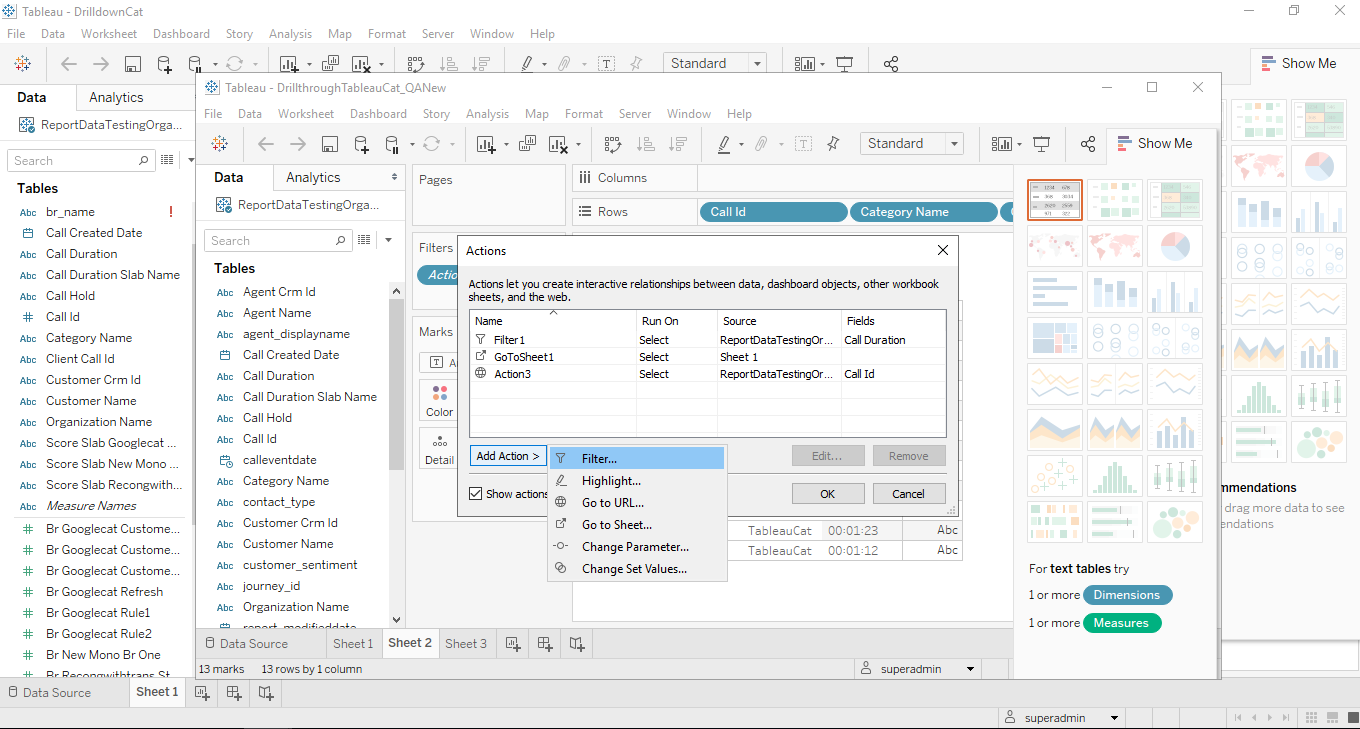
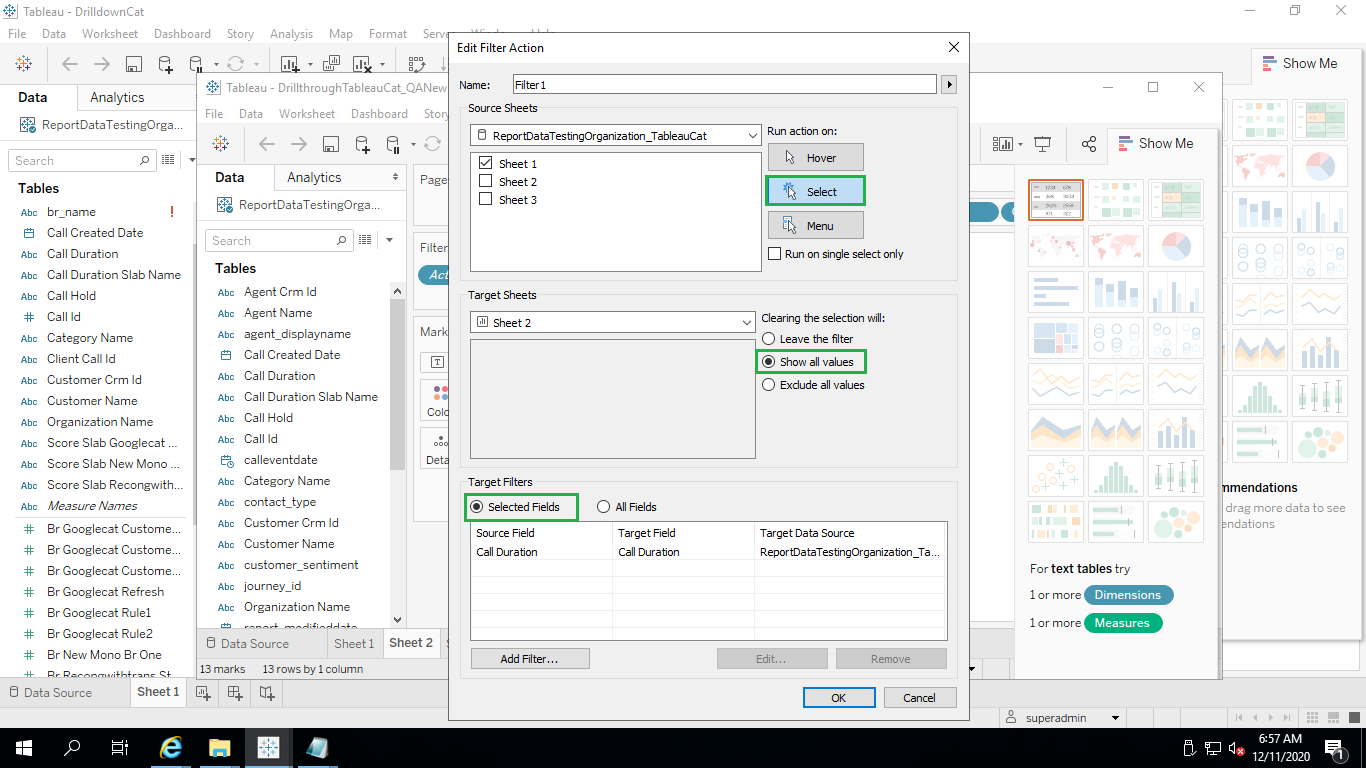
Enter the Action name and select Sheet 1 from Source Sheets and Sheet 2 from Target Sheets. By default, Source Sheet name is displayed in the drop-down. Select the following values from the Filter Action and click OK.
Run action on – Select
Clearing the selection will - Show all values
Target Filters - Selected Fields
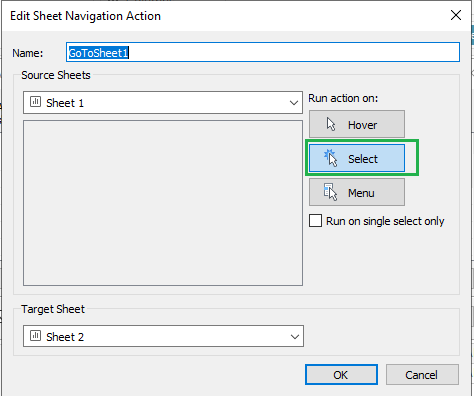
Select Add Action > Go to Sheet. Enter Action name and select Sheet 1 from Source Sheets and Sheet 2 from Target Sheets. Run action by clicking on “Select” and click OK.
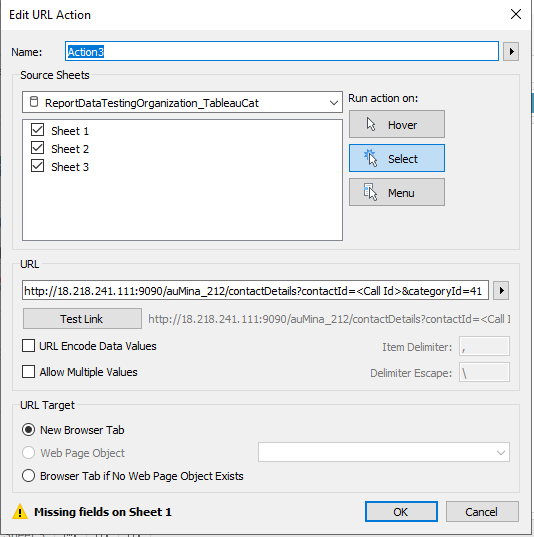
Select Add Action > Go to URL. Enter the Action name and select the sheets. In the URL field, mention Call Details page URL followed by values for placeholders. Run action by clicking on “Select” and select URL Target as “New Browser Tab” and then click OK.
Go to File > Save As and save the workbook in .twb format. This workbook will be uploaded in U-Analyze UI.
Drill down to business rule hierarchies
Connect to a data source - Tableau Server. Tableau desktop needs to be installed in the system which must have access to Tableau Server URL.
Select the datasource from the tableau server existing data sources. Data source name will be in the format of Organizationname_categorynameBrHits. Click Connect button.
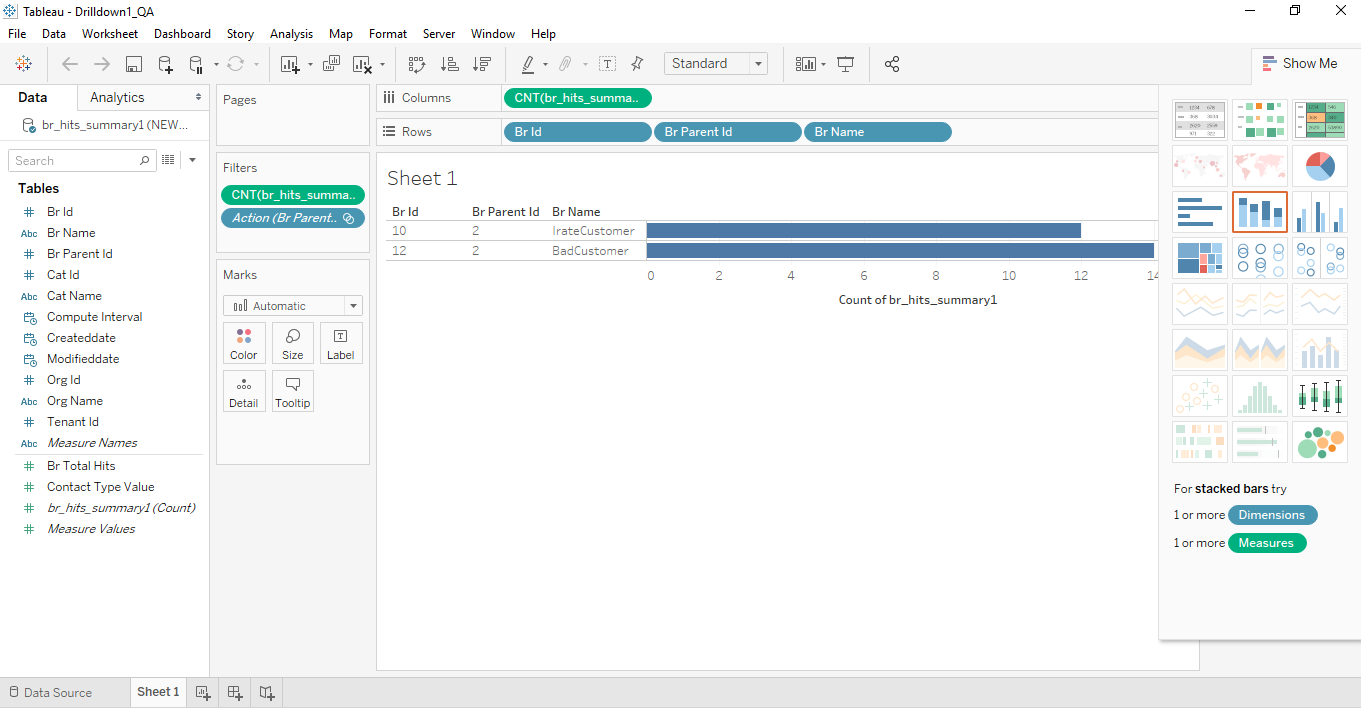
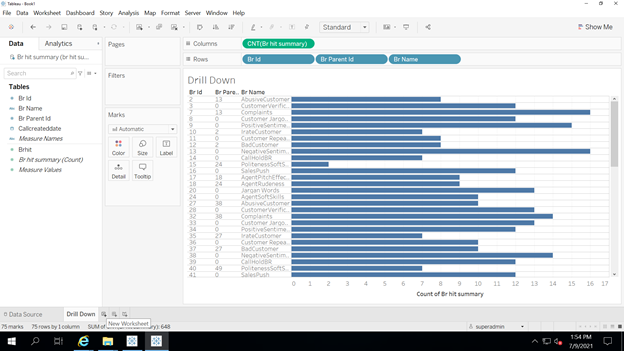
If user drag and drop the values “Br id and Br Parent id” from Measures, it will be taking sum of BR ID’s and sum of parent ID’s for evaluation. Move these values to the top to covert it as dimensions.
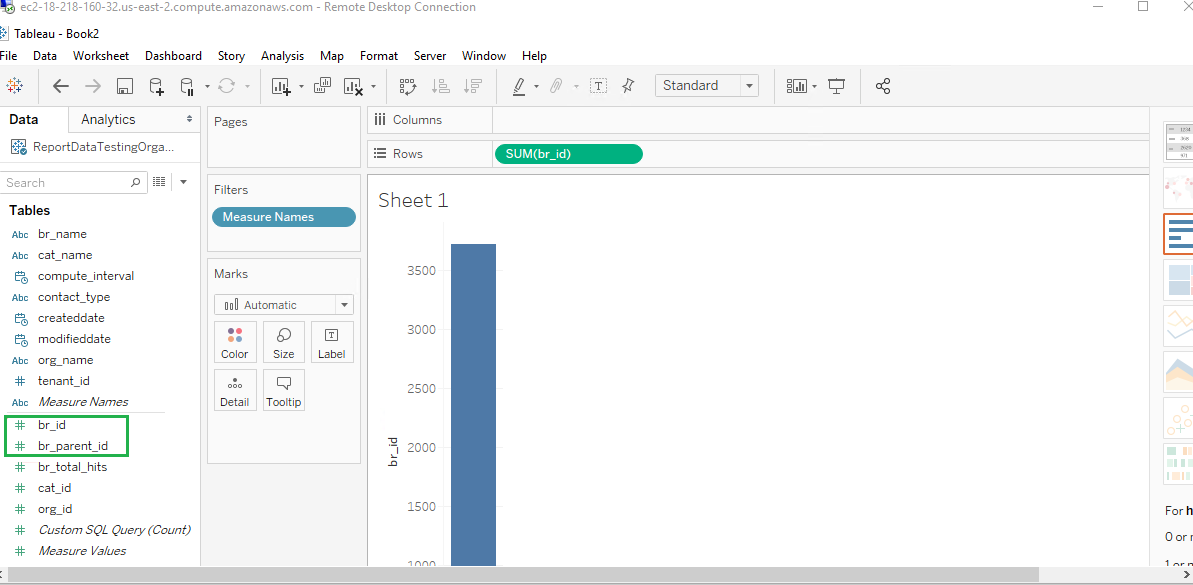
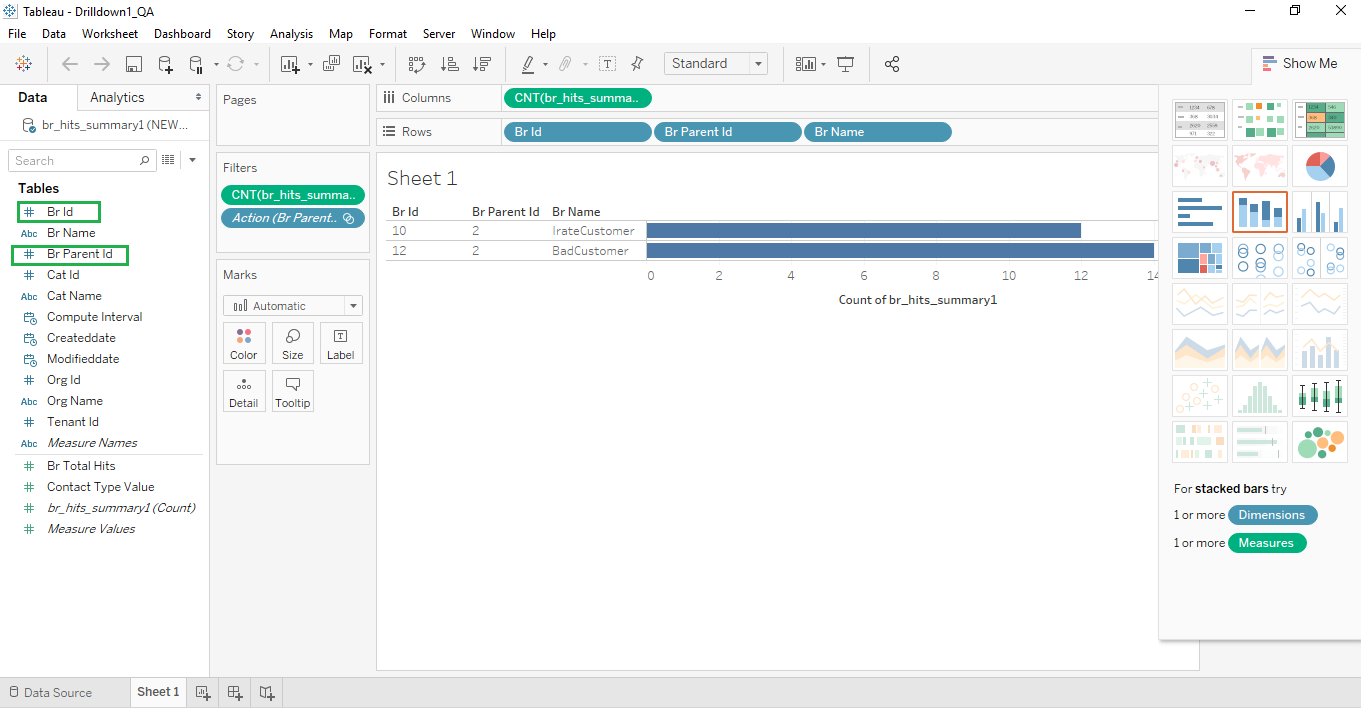
Drag and drop the dimensions “Br id and Br Parent id” in the rows and “Br hit summary count” in the column. These dimensions are mandatory in the worksheet; other dimensions are optional.
Go to Worksheet > Actions.
Click Add Action and select Filter.
Enter the Action name and select Sheet 1 from Source Sheets and Sheet 1 from Target Sheets. By default, Source Sheet name is displayed in the drop-down. Select the following values from the Filter Action.
Run action on – Select
Clearing the selection will – Leave the filter
Target Filters - Selected Fields
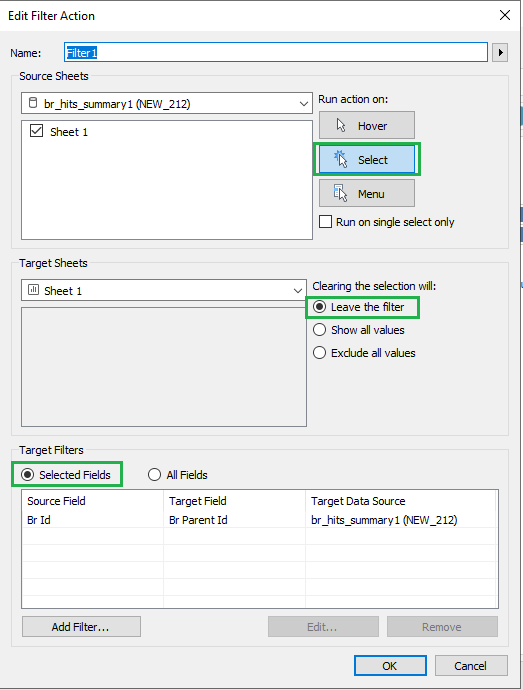
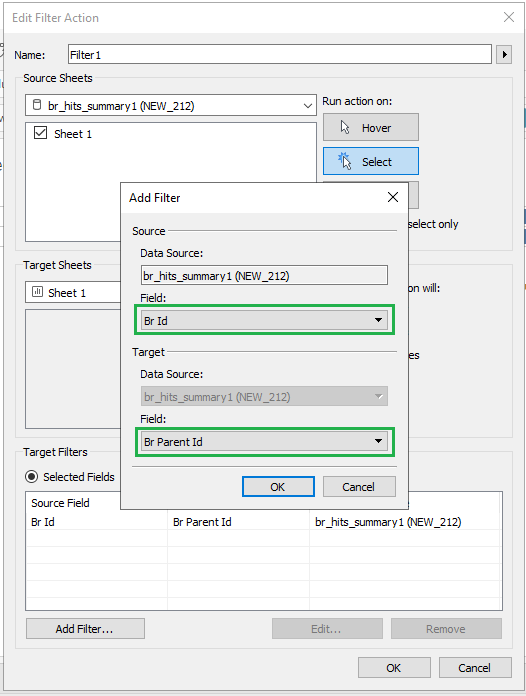
Click Add Filter. Select Br Id from Source field and Br Parent Id from Target field and then click OK.
Go to File > Save As and save the workbook in .twb format. This workbook will be uploaded in U-Analyze UI.
Note
If user adds a new business rule for a category, refresh the Tableau data server to view the newly added business rule in the business rule hierarchies drill down chart.
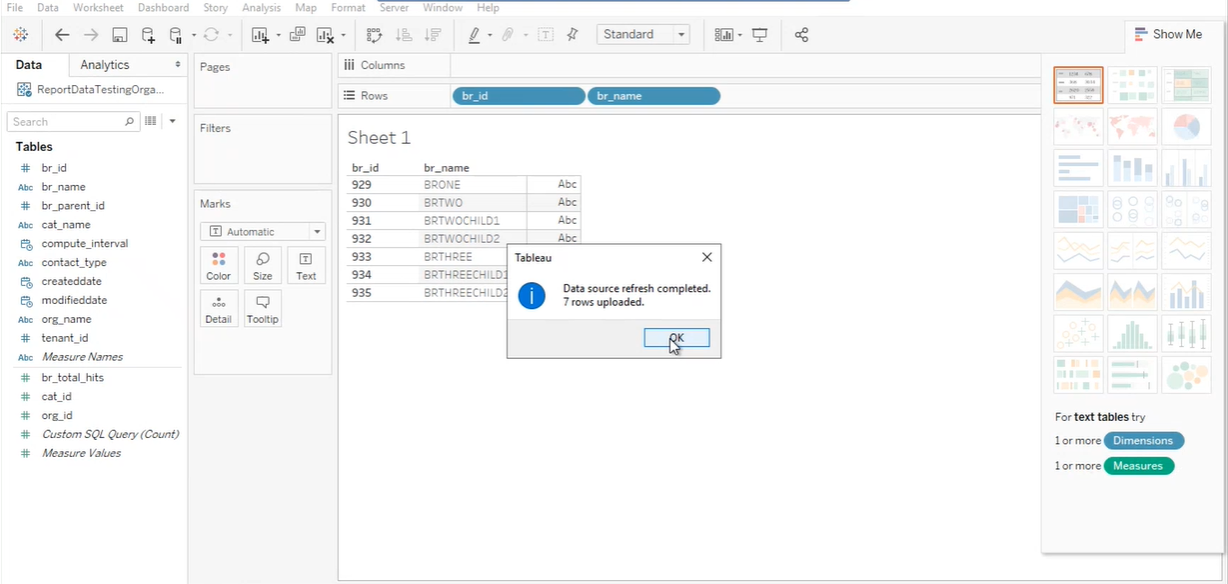
Connect to the specific data source.
Select ‘Refresh from Source’ from ‘Tableau Data Server’
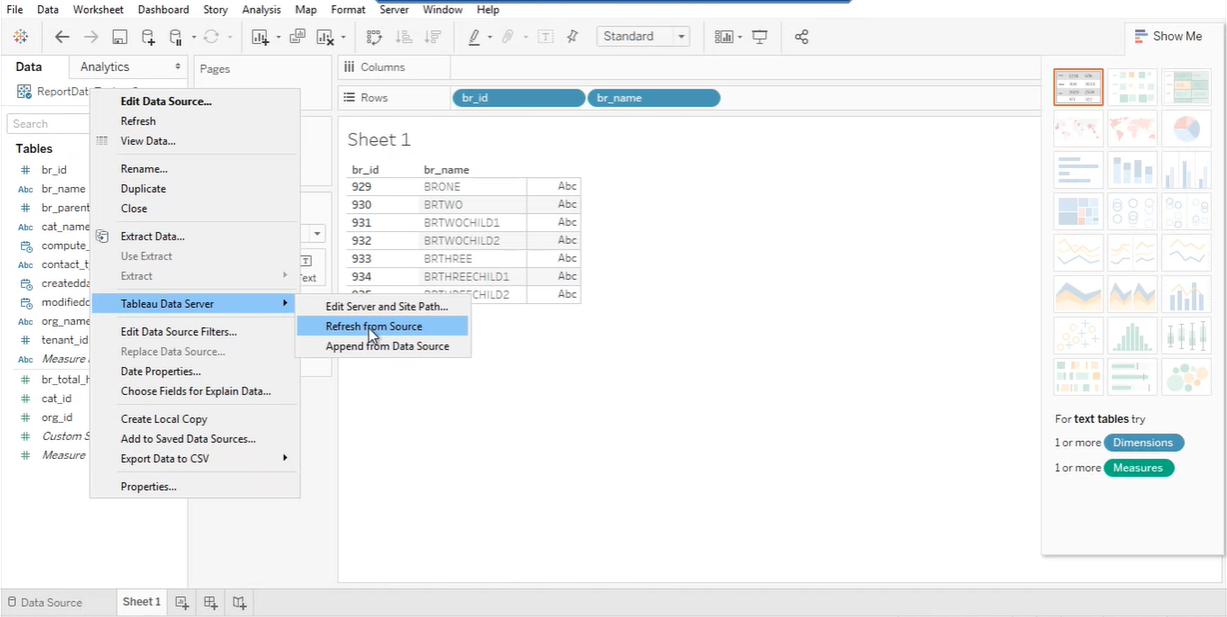
Mention Postgres password.
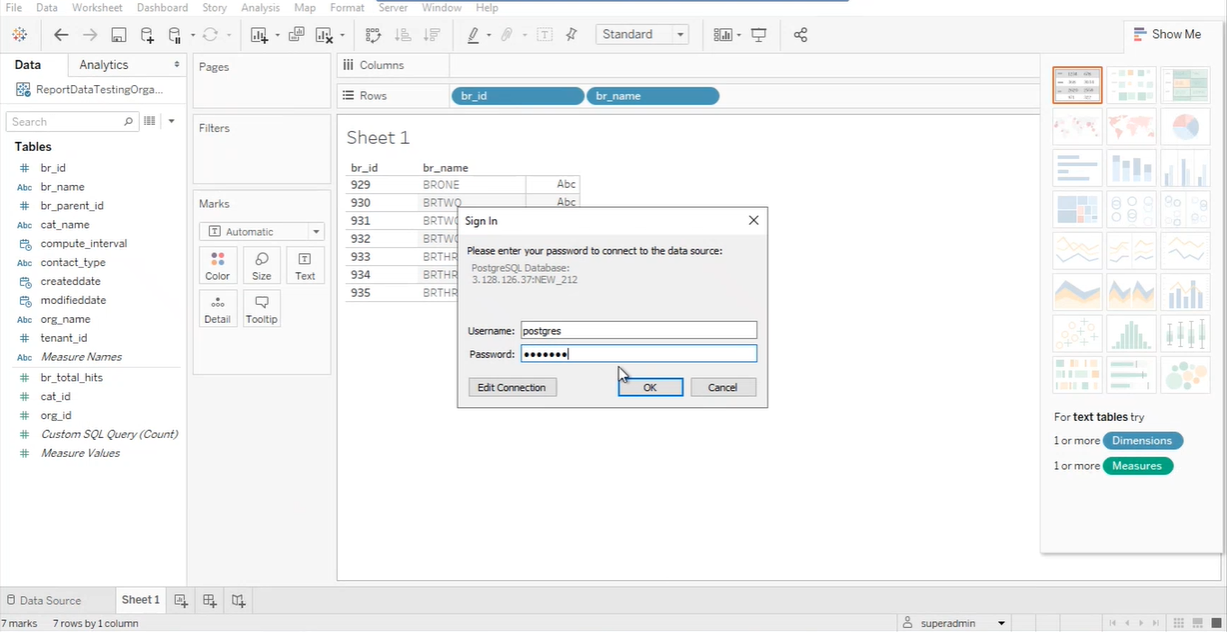
After refreshing data source, the newly added Business Rules will be displaying in the chart.
Drill Up to Business Rule Hierarchies
To implement the drill up business rule hierarchies, follow the steps in the procedure above (Drill Down to Business Rule Hierarchies) and rename the sheet to “Drill Down“.
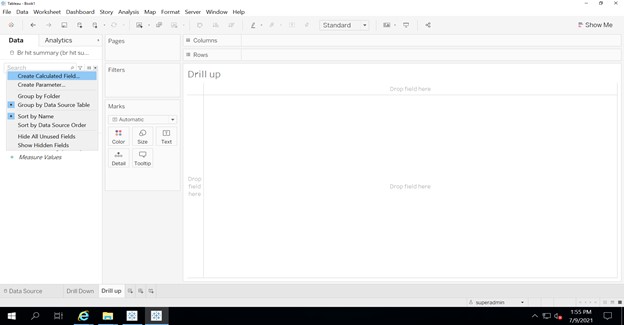
In the same Workbook where the drill down is implemented, create one more sheet and rename the sheet as “Drill Up”.
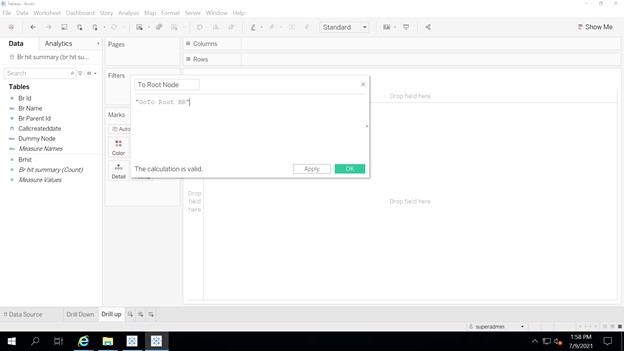
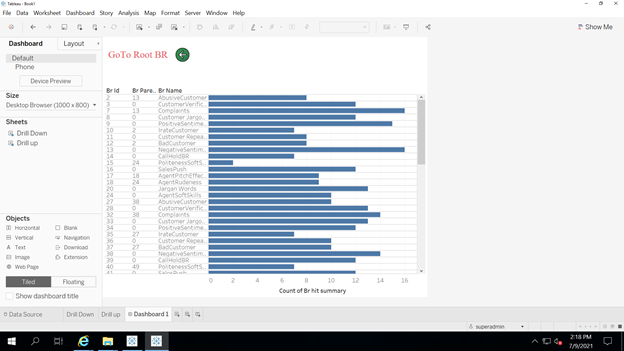
Create a calculated field and name the field as “To root node”. In the calculation space type as “Go To Root BR”. Click on Apply and Ok Button.
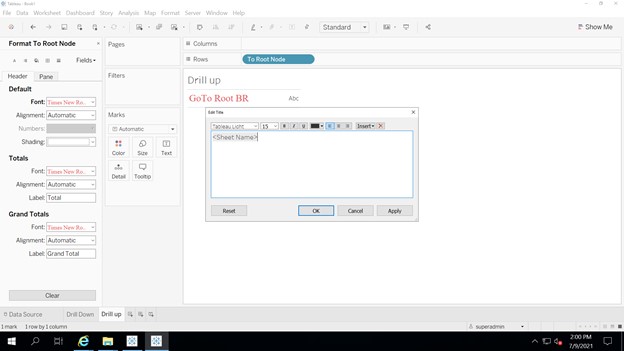
Drag the calculated field and place it in the Rows.
Double click on the sheet header and clear the sheet name.
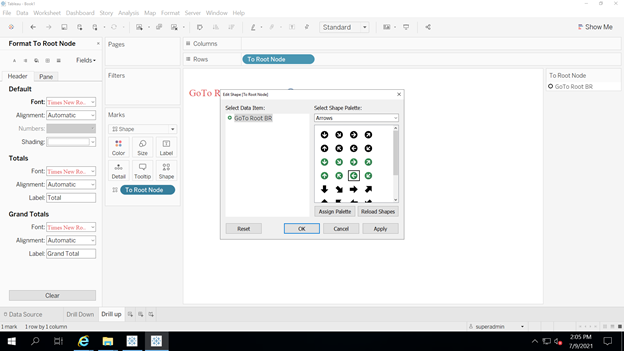
Drag the calculated column against the shapes marks and select the arrow mark
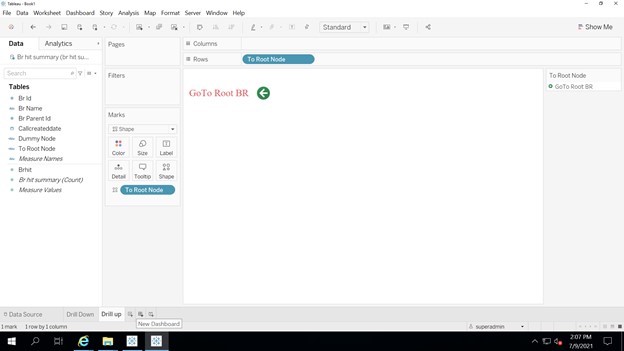
Create a dashboard as shown below
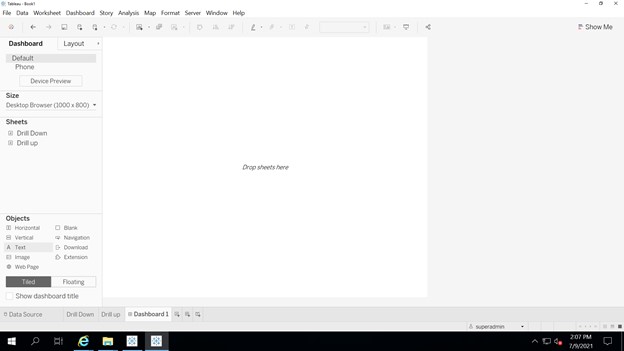
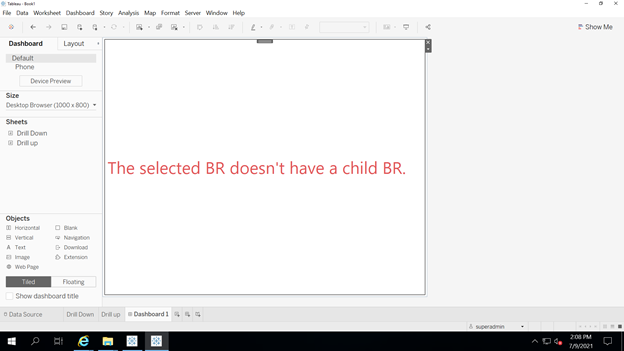
Place a floating text box with the text “The selected BR doesn’t Have a Child BR”.
Place Drill Down and Drill Up sheets and change it as floating containers . Arrange the sheets as Below.
Right click on each worksheet and select hide option, so that only dashboard will be visible.
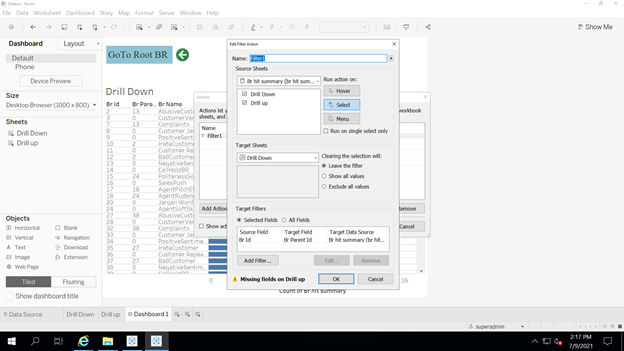
Click on worksheet > actions. Unselect the drill up sheet under source sheet. Click on OK.
Click on dashboard > actions. Select Drill up under source sheet. In the target sheet click on Drill Down. Target Filters ->add filters-> source field BR id. Target field Br Parent id.
Run action as ‘Select’. Clearing the selection will show all values. Click on OK.
 |