Agent Dashboard
This feature allows Agent to view Average Score for calls handled by Agent, Average Score Trend and True BR% Hits for positive and negative score components for the specified date range.
 |
Select the QA monitored score from the drop-down list. QA-monitored scores are fetched from U-Analyze which the Business Analyst has selected scores as QA-monitored scores.
The following error Messages will be displayed for the following conditions:
For the selected Category, if there are no processed calls: “No data is available for analysis for the selected Category.”
When no QA-monitored scores exist for the selected category: “Selected Category does not have any Scores to be monitored by Quality Analyst.”
When no Agents exist, system will display message “No Agents exist for the Organization.”
Select the From date and To date in which the reports to be displayed in the respective fields. By default, system will display the reports for last active 2 weeks.
Note
System will allow QA to select maximum of 1year date range and allow user to select for previous 2 years.
Click Search button to view the Agent Reports for the selected search criteria.
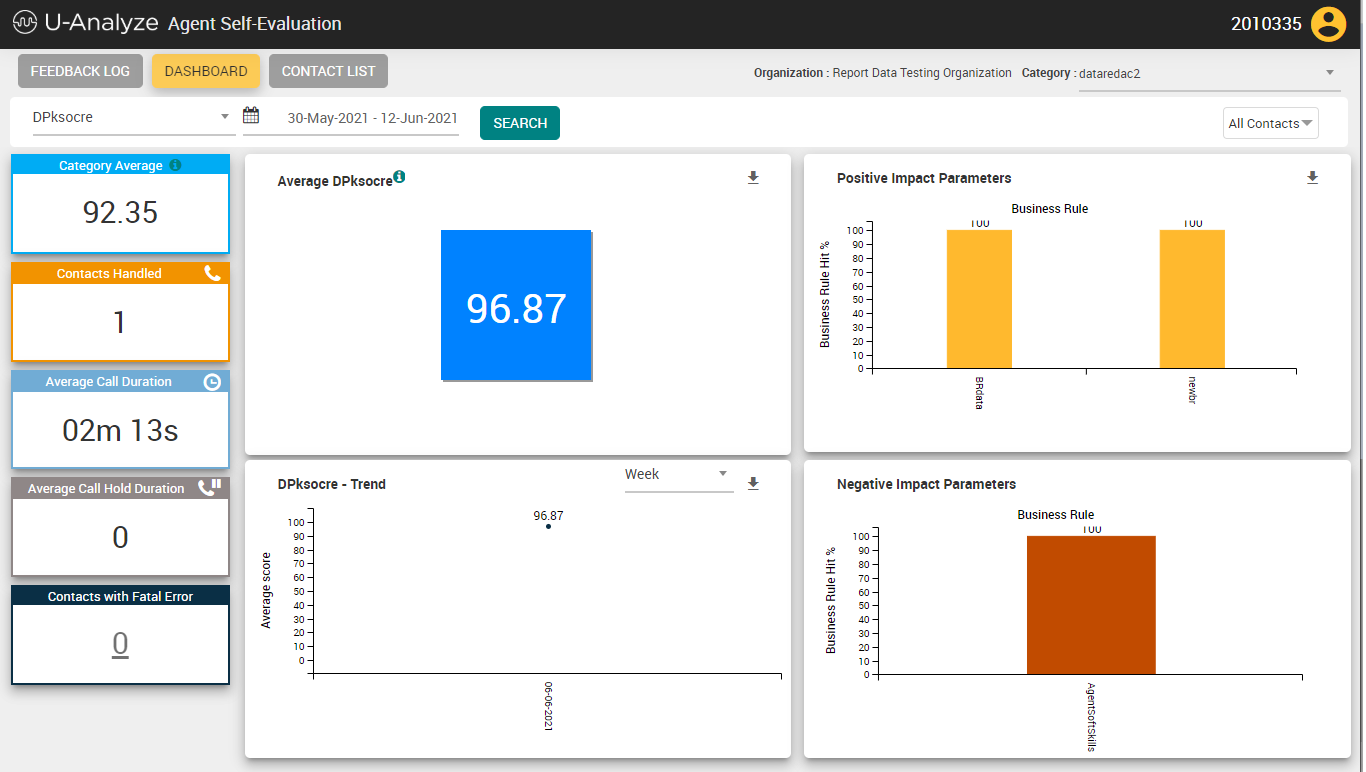
In the left side of page, the following details are displayed. QA can drill down to Fatal error calls.
Category Average - Average score of all the contacts processed under a category at the selected date range.
Contacts Handled – Number of contacts processed for the specified date range
Average Call Duration (hh:mm:ss) – Average Call Duration for the calls processed for the specified date range
Average Call Hold Duration (hh:mm:ss) – Average Call Hold Duration for the calls processed for the specified date range
Contacts with Fatal Error – Number of contacts for which Fatal Error is detected post evaluation for the Agent.
Click on Score Trend, Positive Impact Parameters or Negative Impact Parameters chart to drill down to Contact Analysis screen with the list of contacts based on the filters applied.
Click Download (
 ) icon to download the chart in .png format.