Viewing RPA Concurrent Bots Usage
The RPA Bots Concurrent Report page provides a summary of simultaneous RPA Bot operations in your account over a selected time period.
Using the report helps you to pinpoint peak activity periods and know exactly how your account is performing with regard to your current license – by day or week. X‑Platform calculates and displays up to 30 weeks of historical data for concurrent RPA Bots.
Note
In order for the report to provide data, RPA Resources need to be enabled for your account.
Opening the RPA Concurrent Bots Report
Click on RPA Bots Concurrent Report in the RPA menu section of the X-Console. The report page opens.
Understanding the RPA Concurrent Bots Report Page
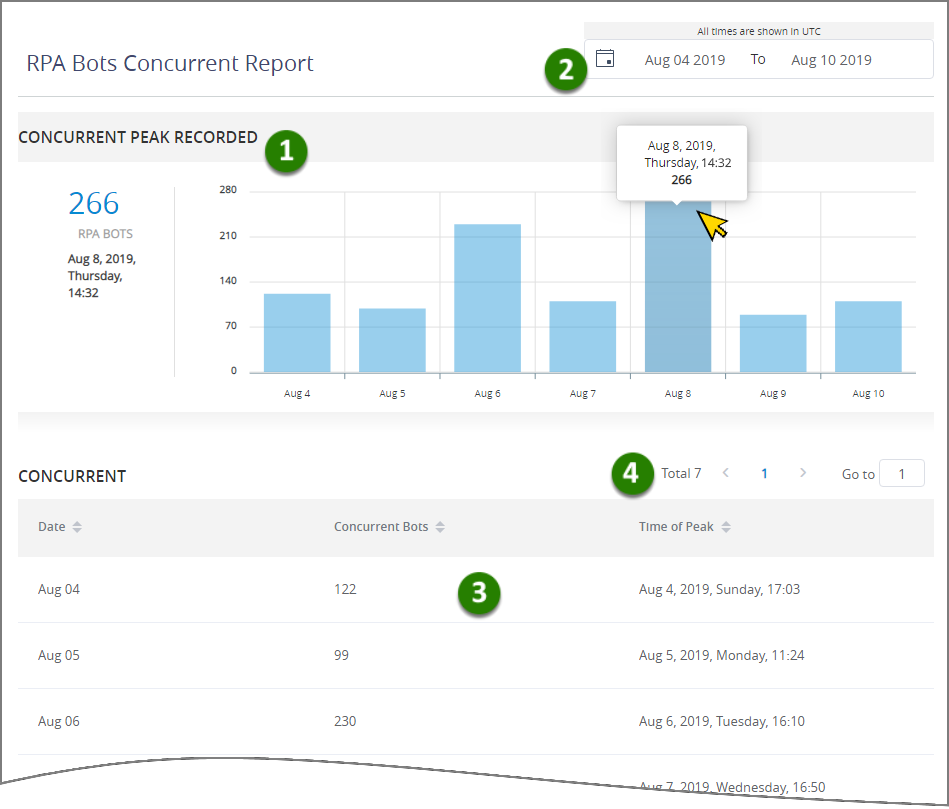
The report features a column chart to display peak concurrent Bot activity, along with a summary table:
 |
Item | Feature | Description | |
|---|---|---|---|
1 | Concurrent Bot Peaks Recorded | Shows aggregated peaks for simultaneous Bot activity in the account for the selected time period. The highest concurrent Bot peak that was recorded in the selected range appears at the left, together with the date and time it occurred. The numbers on the left side of the chart show the total concurrent RPA Bots. The dates below each column show the time period used for calculating concurrency, and will reflect your selection in the calendar date picker:
Hovering over a column in the chart displays a summary for that peak and the date and time it occurred. | |
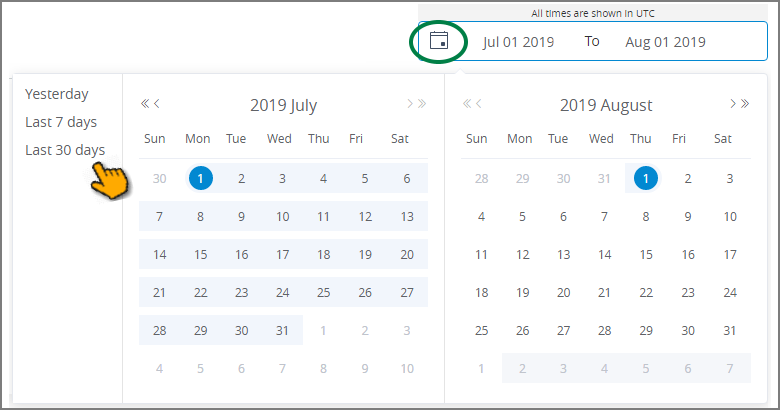
2 | Selected Date Range and Time | The selected timeframe for the analytical data displayed. By default, the last week of RPA Bot activity is calculated and displayed. Clicking on the calendar icon opens a popup where you can select a different timeframe:
To change the range, you can select from the default ranges at the top left of the popup, enter dates in the date fields above each calendar, or click on specific start and finish dates sequentially in the calendar. NoteThe date and time that you select here reflect UTC time. | |
3 | Concurrent Bot Summary Table | The number of active concurrent RPA Bots is provided for your selected time period, along with the exact time (in UTC) of peak concurrent activity. As in the column chart, the time periods shown will change according to your selection in the date picker. By default, dates are displayed from earliest to latest in ascending order. To sort the list in descending order or by another parameter, click on the Sort | |
4 | Report Pages | Shows the current page number, as well as the total number of pages available in the report. Click a specific page number or the < and > direction arrows to display another page, or enter the desired page number in the Go to field. |