Viewing BI Dashboards
U-Assist BI Dashboards help you to explore and understand your account activity data, interactively.
Each Dashboard presents a selected dataset, designed to answer specific questions about account and business activities.
Note
Only a user with the BI Viewer role (or higher) can view Uniphore BI Dashboards.
From the X-Console U-Assist menu, select BI Services. The BI Services page opens with currently available Dashboards displayed:
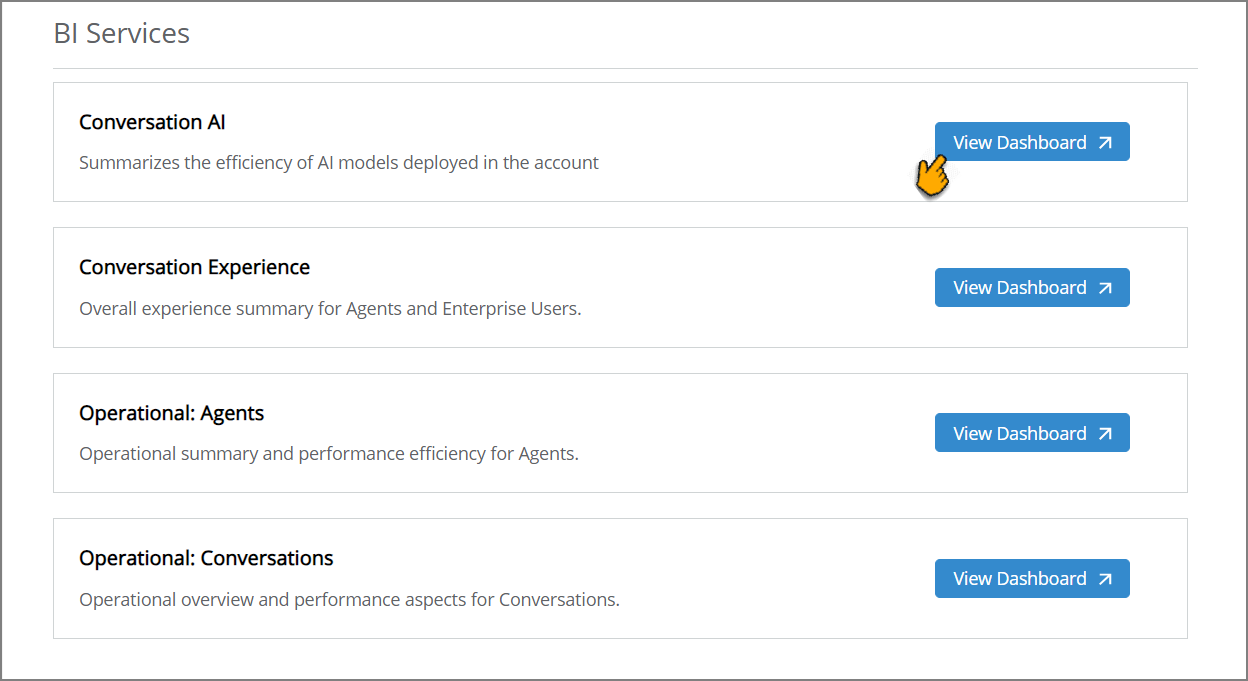
Click on the name of the Dashboard you want to view. The selected Dashboard will be displayed.
Note
If you receive a HTML 401 authentication error when attempting to access the BI Dashboards, make sure that your browser is not blocking third-party cookies. For more details about handling this and similar authentication errors, see the Looker documentation.
Working with BI Dashboards
BI Services enable you to view BI Dashboards for your account and examine activity metrics and data subsets over a selected time period.
You can actively interact with a displayed Dashboard to filter relevant data, as described below.
Looker supports the following activities while viewing a BI Dashboard:
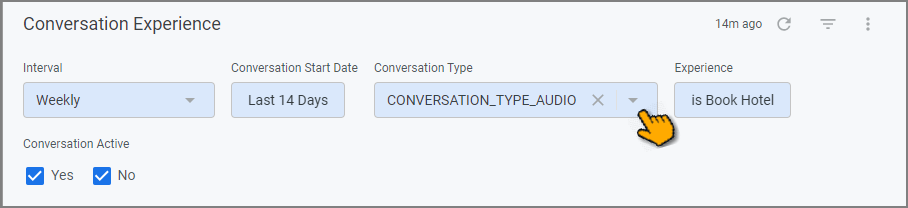
Filter the Dashboard | You can limit which specific data will be used for displayed calculations using the Filter dropdowns found at the top of the Dashboard. The Filters will vary according to the Dashboard you are using:
TipIf the Filter dropdowns are not currently visible, click on the Filter Display To use the Filter, select the values and ranges that you want the Dashboard to focus on, then click the Refresh While filtering is active, all displayed charts, tables and summaries will reflect only data that matches the filter. To remove a Filter, click the X on the right side of its dropdown. The Dashboard will refresh to reflect your updated filtering selection. To quickly reset all filters to their default values, from the upper right corner of the Dashboard, click Reset filters: 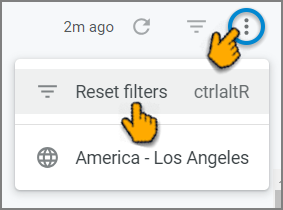 | ||
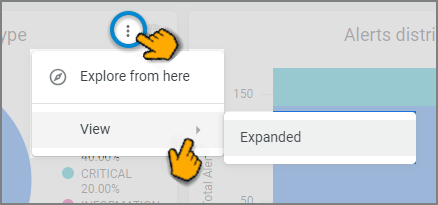
Expand the View of a Dashboard Metric | To view an enlarged image of the selected metric, from the upper right corner of the tile for the metric open the Tile Actions sub-menu and click View > Expanded.
An enlarged popup of the metric will be displayed. | ||
Manage Time Zone | You can select which time zone is used to display Dashboard values. You can choose from:
When the Globe To change the selected time zone, first, from the upper right corner of the Dashboard, click the current time zone option menu: 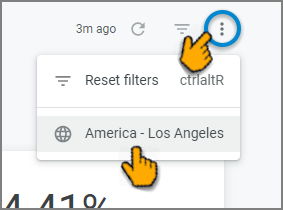 Then, from the dropdown list, select the desired time zone display option: 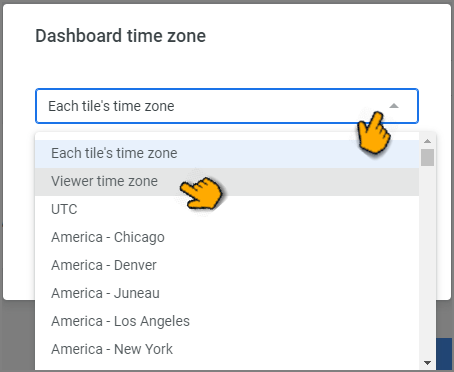 All of the Dashboard titles will be instantly updated to reflect your selection. |


For a complete description of Looker Dashboard features, refer to Looker documentation.