Business Information (BI) Dashboards: Overview
Uniphore provides Business Information (BI) Dashboards for your account, drawn from runtime data. The Dashboards present intuitive views of metrics that answer key questions about chats and conversations in your call center, helping your organization to develop service solutions that better reflect the ongoing and evolving needs of your customers.
Using our BI Dashboards, you and your team can easily access visual insights about customer journeys over time, filter for key values, set activity ranges, manipulate views and more.
BI Dashboards access the full spectrum of your account's activity data and are refreshed at two minute intervals by default. We developed them using Looker, a leading business intelligence software platform that specializes in the preparation, presentation and analysis of enterprise-scale data.
Uniphore provides basic BI Dashboards 'out of-the-box', enabling you to immediately benefit from call center analytics without need for any additional setup activities. BI Dashboards are accessed directly from the X-Console.
 |
Note
For some accounts, Business Information (BI) Services must be manually enabled in order to work with BI Dashboards. If you cannot see the BI Services menu, contact your Uniphore Support representative.
Currently, Uniphore provides the following prepared U-Assist Dashboards for each account, out-of-the-box:
Conversation AI
Conversation Experience
Operational: Agents
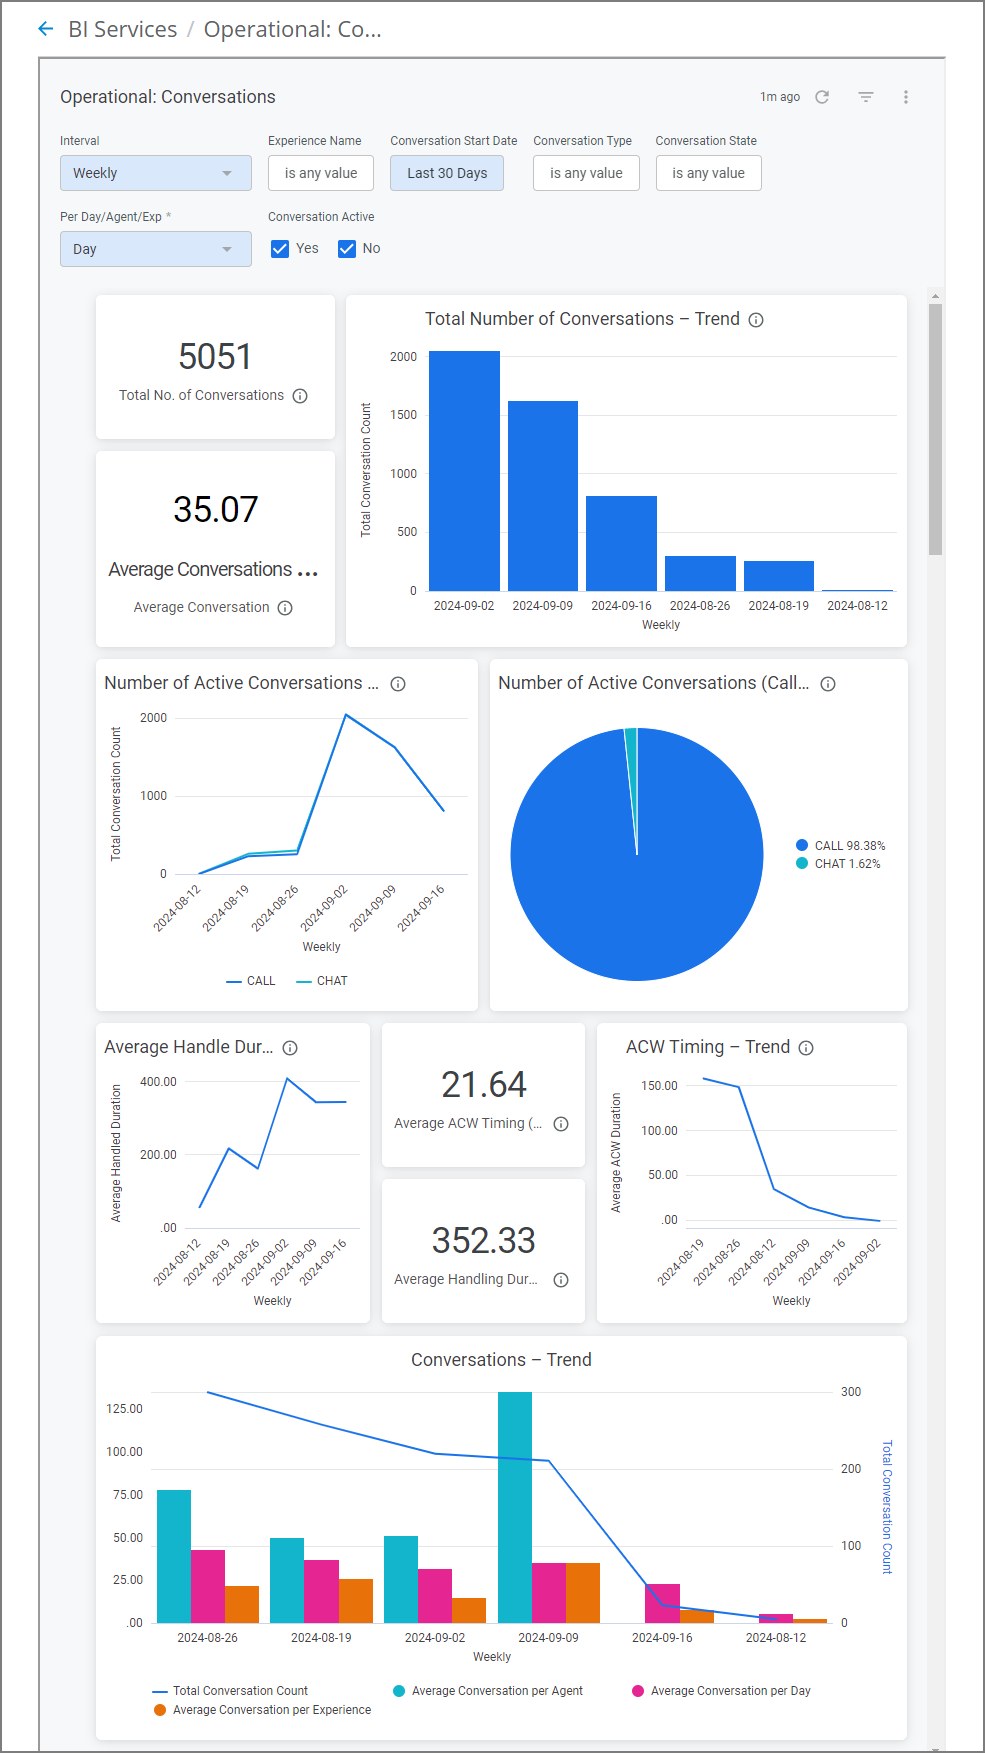
Operational: Conversations