Team Performance Dashboard
This dashboard offers an overview of team performance metrics, such as total interactions, average handle time, and average agent performance scores. It provides insights into overall team efficiency and productivity.
Note
The Team Performance Dashboard is available only for Analysts and Administrators.
What insights can you get from the Team Performance dashboard?
Callout | Name | Description |
|---|---|---|
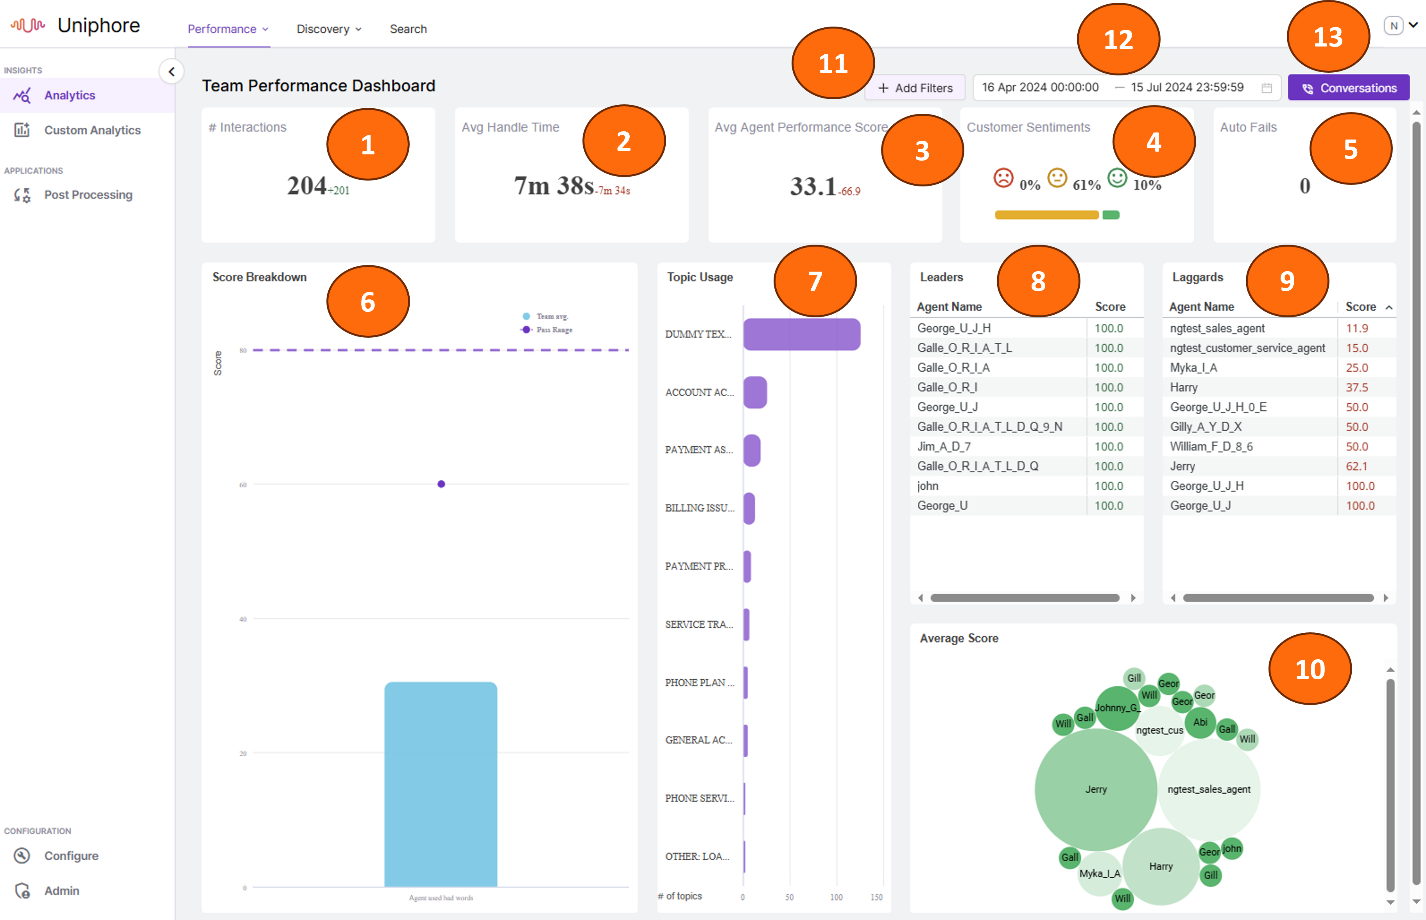
1 | Interactions | Total number of interactions. |
2 | Avg Handle Time | Average handle time of conversations. |
3 | Avg Agent Performance | Average performance score agents. |
4 | Customer Sentiments | Percentage of each sentiment in interactions. |
5 | Auto Fails | Total number of auto-failed scorecards. For more information on Auto Fail, see step 5 of Create Question. |
6 | Score Breakdown | The Team's average score for the selected Scorecard and its Pass criteria. Drill down to see the scores of the subsection and questions. |
7 | Topic Usage | Most frequently used topics in conversations. |
8 | Leaders | List of top-performing agents with their score. |
9 | Laggards | List of underperforming agents with their score. |
10 | Average Score | Names of agents contributing to the average score, with individual scores viewable on hover. |
11 | Add Filter | Filter data by Agent ID, Organization, Scorecard and Call Direction. |
12 | Date Filter | Filter data by specific date range. |