How do I design a Custom Dashboard?
The Designer enables you to create custom dashboards using available fields and add custom fields as needed.
Note
To create a dashboard, you must have Manage Access and Edit Access level for the folder where you want to save the dashboard.
To create a dashboard, follow these steps:
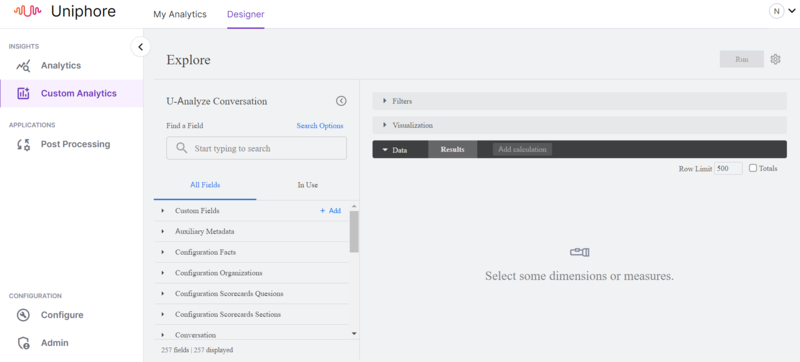
Navigate to Designer.
Add fields from the All Fields tab, which displays all available fields in Explore. The In Use tab shows all Explore fields that are currently in use.
Use the Find a Field search bar to search and select fields matching specific terms and criteria.
Note
The data shown in an Explore dashboard is determined by the dimensions and measures selected. A Dimension can be a group or a bucket of data, while a Measure is information about that bucket of data.
Use the Custom Fields to create new fields.
While most fields are created by developers, custom fields allow for ad hoc custom dimensions and measures. Admin permissions is required to use this feature.
Once your query is set up, click Run.
Open the Visualization tab and select the type of visualization that best displays your data.
Click Save from the gear icon menu.
Select As new dashboard from the sub menu, which opens a Save as a new Dashboard window.
Enter a name for your new dashboard in the Title field.
This name applies to both the tile and the dashboard which can be modified at any time.
On the Settings tab, select the folder where you want to save your dashboard. Ensure you have Manage Access and Edit Access level for the folder.
On the Filters tab, click Explore filters to use them as dashboard filters. Custom filters cannot become dashboard filters but remain as tile filters.
Click Save. The Explore will be saved as a query tile on the dashboard.